Aquaveo & Water Resources Engineering News

Importing SRH-2D Native Files

Did someone send you files for an SRH-2D project but they are not part of an SMS project? You can import native SRH-2D files directly into SMS even when there is no associated SMS project file. This blog post will go into more detail as to how this is done.

First, make certain you have all of the SRH-2D files in the same directory. To review, the native SRH-2D input files include the following:

  • SRHGEOM: contains the mesh geometry
  • SRHHYDRO: contains the SHR-2D model control parameters
  • SRHMAT: contains the mesh material data
  • SRHSEDMAT: contains the sediment material properties
  • SRHMPOINT: contains monitor point data
  • XYS: contains any XY series data used in the project

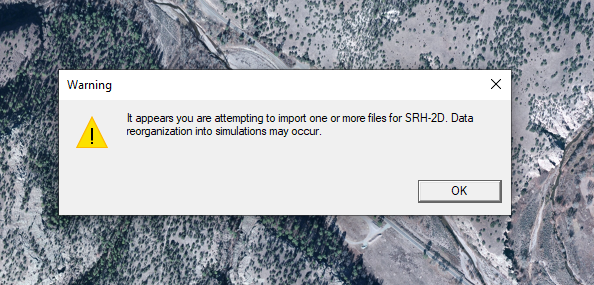
After you have all of the needed files, you can import the SRH-2D project by opening the SRHHYDRO file. When opening the SRHHYDRO file, a warning message will appear letting you know that some data reorganization may occur.

Import SRH-2D native files warning

When importing the SRHHYDRO file, SMS will search the directory for other files related to the SRH-2D project. As long as the files are in the same directory and use the same naming convention, the SHR-2D project will be imported into SMS.

Solution files and other output files will need to be imported separately into SMS. This includes the XMDF.h5 file.

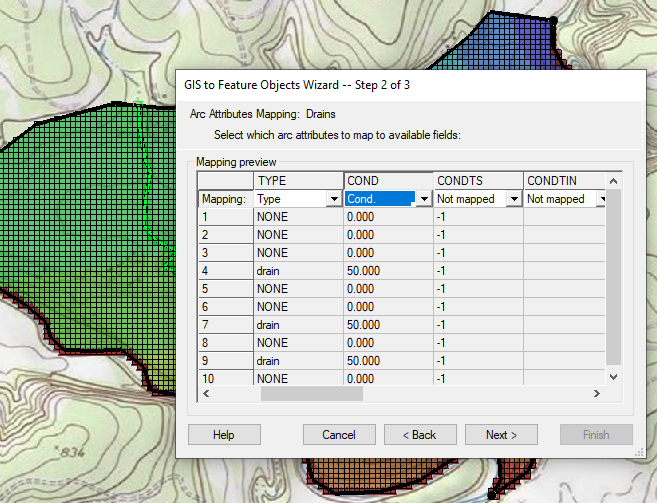
After importing the native project files, it is strongly recommended to review how the simulations have been set up in SMS. Check the boundary conditions and materials to make certain they imported correctly. Also, you may need to import certain input files, such as a restart file, separately to complete the simulation setup.

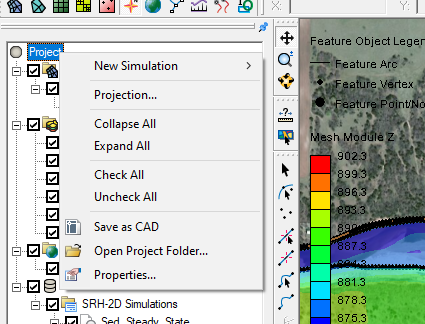
You may also need to clean up the project to make using it easier in SMS--this may include renaming items in the Project Explorer or adjusting the display. Also, it should be noted that SMS allows you to import multiple SRH-2D projects into the same SMS project.

Try out importing SRH-2D native files into SMS 13.1 today!

Blog tags: 

Refining 3D Grids in GMS

It's common to need to refine part of a grid in your GMS project. For this reason, GMS provides a few tools and methods for refining parts of a grid. This post will review some of the options for refining 3D grids in GMS.

In general, when building a grid in GMS, you don’t want a grid that is too refined, as this will cause issues in the model run. You also do not want a grid that has cells that are too large to pick up vital information from key locations. To solve this, you can refine the grid in key locations.

When generating a 3D grid or unstructured grid (UGrid) from a map coverage, you can use refinement points to refine specific locations. Refinement points require setting the map coverage up to have the Refinement option turned on. Then create points on the map coverage and define those points as refinement points. When converting the map coverage to a grid, the grid will be refined in the area of the points.

Defining a Refine Point in GMS

With an existing 3D grid, IJK boundaries can be added into the grid to refine an area. You can do this by using the Select i, Select j, or Select k tools to select a row, column, or layer, then right-click and select the Redistribute command. In addition, you can use the Grid | Redistribute layers command to redistribute layers.

If you have an existing UGrid, you can quickly refine the grid on a cell-by-cell basis. You do this by selecting a cell, then right-clicking and selecting the Refine cell command.

The above techniques work well for refining a small area of the grid or when refining grids that are not complex. Again, it is not recommended to overly refine a grid as this often causes issues to appear during the model run. If you do need to refine a large area of the grid, it is recommended to use a child grid.

Try out using the grid refinement tools in GMS today!

Blog tags: 

New Features to Check Out in WMS 11.1

Aquaveo is pleased to announce the release of the Watershed Modeling System 11.1 Beta! With this release, WMS contains changes and improvements to some of the features. If you have already downloaded WMS 11.1 beta, you might have already noticed some of the changes. We'd like to highlight a sampling of some of the new functionality you can expect to find in WMS 11.1.

GIS Module

A lot of the GIS module functionality has been made to perform faster. This includes performing GIS parameter computations directly from shapefiles, performing shapefile to feature object conversion, and displaying large raster files. Also added the GIS module, through the new Online Maps feature, there has been an addition of Web-based Google tile map services that can be displayed as background maps. Improvements have also been made to the list of many potential online sources that can be used as data sources for the online maps. There have also been changes to the display and operations on images and raster files of various types.

Raster of West Virginia
GSSHA

The capabilities of GSSHA model implementation have been expanded within this new release. These include the ability to view multiple scenario hydrographs in a GSSHA solution and the added capability to run calibration on Richard's Equation parameters within GSSHA.

Map Data Module

More options have also been extended when it comes to the Map Data module. A new Extract Features tool allows users to directly convert raster data to stream and ridge/embankment centerlines. In addition to new tools, the Map flood tool has added an option to use local shapefiles that can be used when web service data are not available, where those shapefiles can be used for Base Flood Elevations and floodplain boundary polygons.

These are just a few of the new features in the WMS 11.1 Beta. Try out these features and more by downloading the WMS 11.1 Beta today!

Blog tags: 

Reintroducing HEC-RAS 1D in SMS

Earlier versions of SMS allowed modeling HEC-RAS 1D models. HEC-RAS 1D is used for performing water quality analysis. Though once part of SMS, it was removed because it was supported by Aquaveo's Watershed Modeling Software (WMS). However, with the inclusion of HEC-RAS 2D, the interface for HEC-RAS 1D has been restored into SMS 13.1.

Using HEC-RAS 1D in SMS primarily makes use of the 1D hydraulic centerline coverage and the 1D hydraulic cross section coverages. It also makes use of the material coverages, with the added bonus of now being able to use SRH-2D material coverages. Once you have defined the materials, centerline and cross sections in your project, you can switch to the 1D Module. The 1D Module has also been reintroduced in SMS 13.1.

Example of HEC-RAS 1D in SMS

Once in the 1D Module, you can access the HEC-RAS 1D menu where you can find the HEC-RAS 1D materials and model control. SMS allows you to select the material coverage to use for HEC-RAS 1D, and then assign that material coverage to the HEC-RAS 1D model. After you have set up your HEC-RAS 1D model in SMS, you can export a project file to use in HEC-RAS.

With HEC-RAS 1D in SMS, you can take advantage of all the tools offered in SMS to build your HEC-RAS 1D project. This includes tools to extract cross sections and centerlines from imported data or existing projects. SMS's editing tools can also be used to adjust the centerline or cross section before importing the project into HEC-RAS. Furthermore, SMS allows you to use profile plots and the various viewing options to review your cross sectional data. It is recommended that you review your HEC-RAS 1D project in SMS before exporting the project file.

HEC-RAS and SMS together increase your water modeling options. Try out using the reintroduced HEC-RAS 1D in SMS 13.1 today!

Blog tags: 

Importing Older Projects into GMS

Do you have an older GMS project that you need to open in the current version of GMS? Maybe you want to bring an older project into a newer version of GMS so you can make use of new features that have been added to GMS. Working with older projects can sometimes be tricky. Older versions of GMS are no longer supported and will break down over time. This article will explain more about why this happens and what can be done to get your older projects into a current version of GMS.

Generally speaking, GMS rarely has problems opening projects that are only a few years old. For example, the current version of GMS is version 10.5. Projects created in versions as far back as GMS 10.0 or 10.1 are likely to open without any issues For projects that are older, for example, projects that were created more than ten years ago, some issues may occur.

Over time, changes to the GMS interface, changes to the Windows operating system, and other factors may cause your project to not open in a current version of GMS. Also, how the data files were stored may cause the data to be unreadable.

When you have an older project that has failed to import into GMS, you can try a couple methods to get it into the current version of GMS.

Error opening an older project in GMS 10.5

The first method is to migrate the project through different GMS versions. This is done by opening the project through consecutively more recent versions of GMS. For example, if your project was originally built in GMS 8.1 and does not open in GMS 10.5, you could start by opening the project in GMS 9.0, and then saving the project if it imports correctly. After this, try opening the project in GMS 10.0 and saving the project again. Finally, see if the project opens in GMS 10.5 and save it. While doing this stepping process, review the project to make certain it remained intact. Some corrections are likely needed because of how the migration process functions.

Aquaveo’s technical support team can help you obtain older versions of the software if you have a current license.

The second method is to rebuild the project in the current version of GMS using files from the original project. For MODFLOW projects, this is done by importing the native MODFLOW files. GMS can also read the MODFLOW files that are exported by GMS. You also may need to import individual files, such as the map files or grid files. Using this method you may not get everything out of the older project, but should be able to obtain enough to create a complete, working project.

If you need additional help with importing an older project into the current version of GMS or any of our software, contact our consulting team for assistance.

Blog tags: 

Using the Time Series Editor

Do you have an older text file that is in a format that isn’t quite right for your project? Reformatting an older file can be time consuming. Using a time series editor or similar tool can make reformatting the text easier. Provided with WMS is the Time Series Data Editor application.

Using the Time Series Data Editor allows you to reformat files that are not correctly formatted. To do this, the application provides a number of tools. First off, the application can be used for both time series data and XY series data. Once the time series or XY series data file has been imported into the Time Series Data Editor, the application allows you to adjust how the text file is formatted.

For example, perhaps the text file has been formatted using a time stamp where the date is written without a space between the day, month, and year making all three a single column. The Time Series Data Editor allows you to separate out this date format into separate columns

When importing the files into the Time Series Data Editor application, you can select to import using a fixed width or using a delimiter such as a tab or space.

Once you've imported your data, the Time Series Data Editor will display a graph of the data. From here, if necessary, you can make adjustments to individual points in the data.

Time Series Data Editor example

The Time Series Data Editor also allows you to generate either time series or XY series data from scratch.

After you are satisfied with how the data appears, the Time Series Data Editor allows you to export the data into a number of different formats.

While the Time Series Data Editor is packaged with WMS, it can also prove useful for data that needs to be formatted for GMS, SMS, or other applications. Download the Time Series Data Editor with WMS today!

Blog tags: 

New Project Explorer Commands for SMS 13.1

With the release of SMS 13.1, you might have noticed a few new commands in the Project Explorer right-click menus. The Project Explorer, or data tree, in SMS contains a list of modules and objects that have either been imported into the project or created in the project. Right-clicking on any of these objects will produce a number of commands to perform specific functions or launch certain tools.

Over the development of SMS, the number and type of commands in the Project Explorer have fluctuated. Changes are made to enhance the use of SMS. With SMS 13.1, new commands can be found when clicking on the Project icon at the top of the Project Explorer.

Project Explorer Right-Click Menu for Projects

In this new right-click menu, you will find several commands that have become common in other Project Explorer right-click menus. These include a New Simulation sub-menu and a Projections command. The Projections command will open the Display Projections dialog to set the projections for the entire project. There is also an Open Project Folder command that will open a file explorer window to show the location of the saved project. A Properties command has been added to see details about the project, and contains a place to make notes about the overall project.

These commands also include collapsing or expanding all of the objects in the project. For the Project menu, this would collapse all of the items so only the Project icon is shown, or expand the data tree to show all objects in the project. There are also commands to toggle off or on all data in the project.

Finally, there is a new command, the Save as CAD command. This command will allow you to save a CAD file that contains CAD data generated from all visible data in the Graphics Window.

The new right-click menu commands give you more options for working with data in the Project Explorer. Try this out in SMS 13.1 today!

Blog tags: 

Importing a Shapefile to the DRN Package

Do you have drainage data in a shapefile that you would like to import into GMS to use for the drainage package in your MODFLOW project? Shapefiles are capable of holding a variety of information, including drainage data and other data used by MODFLOW. And a lot of software are capable of converting parts of a MODFLOW project into a shapefile.

If you have a shapefile with drainage data, it can be used for the DRN package in your MODFLOW simulation. This is done by using the following workflow:

  1. Use any of the methods to open a file to import your shapefile into your GMS project.
  2. One the shapefile has been imported into the GIS module, check to see if the conductivity values for the drains were imported with the shapefile. In most cases, this will happen automatically.
  3. In your MODFLOW conceptual model, create a map coverage with the drain option turned on in the coverage setup.
  4. Back in the GIS module, use the GIS | Shape > Feature Object command to open the GIS to Feature Objects wizard.
  5. In the first step of the wizard, make certain the drain coverage is selected and the correct shapefile is selected.
  6. In the second step of the wizard, make certain the Type and Conductivity columns are set correctly.
  7. Shapfile converstion to Drain feature objects
  8. After converting the shapefile to the map coverage, review the arcs and attributes. Clean up the coverage if needed.
  9. Finally, map the coverage to your MODFLOW model.

This workflow can be used for other MODFLOW attributes that are in shapefiles and need to be added to your MODFLOW project in GMS. For example, this workflow could be used to import a shapefile for wells, rivers, or other MODFLOW features. This workflow can also be used when importing MODFLOW projects into GMS where the MODFLOW project was created using other software.

Try out using shapefiles to import drain data into GMS today!

Blog tags: 

Creating Water Levels in AHGW

When using Arc Hydro Groundwater (AHGW) with ArcMaps, you can create a line that represents a water level, or other structures in your cross section 2D plots. This article will discuss some of the ways to do this.

Inserted water level in ArcMap

If the data is available as a raster surface of water level data, you first call the "Create XS2D Line Feature Class" tool to set up a line feature class for holding the data. Then you will run the Transform Raster to XS2D Line tool, which will insert the line feature for the raster elevation levels that intersect the cross section.

If a raster is not available, you can create a water surface line, but a little more work will be involved.

First, run the Create XS2D Line Feature Class tool once you have the basic cross section set up, to hold the water level line.

Next, you'll have to do one of the following:

  • If you have a general idea of the water level, enter the water level line manually. Manually draw in the water level line, using the Create Features tools built into ArcMap to create polyline features. This is all manually done, and may not match the more detailed data you might have.
  • If you have an image or drawing of the water level for the cross section you're working on, you can insert it behind the XS2D cross section in a way that will match the size and scaling of the cross section. While it is typically used for existing diagrams of cross sections, it could also be used to show the water levels if you happen to have such an image.
  • If you have the water level data as points, you could also add them to an XS2D cross section. This takes point and/or line features with XYZ data and transforms them onto the XS2D cross section. Points at the ground location are used to project onto the XS2D Cross Section, and are given an elevation value based off of a ground elevation raster, not a water level. But, if the water level data is sparse, adjust the values of the water level points to known values (manually), and then follow the first suggestion (manually drawing a line) but snapping the line on these imported points.
  • Finally, if you have water elevation values at known distances along the line, you could simply import them via a spreadsheet, using the guidelines below:
    • The X value in the XS2D data frame is the distance along the SectionLine feature used to create the XS2D data frame. So if a section line is 1000m long, X=0m is for the start, and X=1000m is for the end. You could automatically calculate this distance if you don't have it by running the Add XY Coordinates (Data Management) tool to get the X values in the attribute table, and then copy them to a spreadsheet.
    • The Y values in the XS2D data frame are simply real-world elevation values, multiplied by the Vertical Exaggeration value of the XS2D data frame. For example, if you have a water level of -100m, and a vertical exaggeration of 20, then it will be plotted in the XS2D data frame with a Y value of -2000 (-100 * 20).
    • After getting the X values (distance along the curve), you could simply calculate the Y values as well. If you have depth values, be sure to convert the water levels to elevations, and once you have elevations, multiply by the vertical exaggeration.
    • Then, run the Add XY Data tool in ArcMap. Put the points into an XS2D point layer, and add it to the XS2D cross section data frame. Then make an XS2D line feature class (as mentioned above), and use the create polyline tools to sketch out the water levels (as mentioned above) - basically connecting the dots. When making the line features, make sure that they snap to the points you just created.

Try using AHGW to create water levels or other structures in ArcMap today!

Blog tags: 

Tips for Reprojecting Quadtrees

Are you using a mix of projections or coordinate systems in your SMS project? SMS allows for using data with a variety of projections. That said, when using multiple projections, care must be taken in how the data is imported and incorporated into the project. Issues can appear with mixing certain types of projection units, such as meters and arc degrees. Also, there are limitations for reprojecting certain geometries, such as quadtree grids.

If your project contains a quadtree grid, here are tips for getting the projection of the grid to align with your project projections.

Display Projections for a Quadtree
  1. Make certain that the Display Projection has been set before importing any data or creating any coverages or geometries. Doing this will define the units and projection for any created geometries even though your imported data might be different.
  2. Reproject imported data to match the display projection. A warning will appear about a round-off error, but in most cases the round-off error is not going to affect the final project. It is important to reproject the imported data so that it matches the display projection in order to avoid large errors when running the model. Note that an imported quadtree cannot be directly reprojected, and while it can be used to locate values needed for generating a new quadtree, the imported quadtree should be removed instead of reprojected.
  3. Review all of the data to make certain it aligns correctly. If you have a lot of imported data, this is a particularly important step. You can use the Translate to make minor adjustments if needed, but this is not recommended if there is a large misalignment.
  4. Once you have verified that all of the imported data is aligned, then create the quadtree grid using the quadtree generator coverage. Make certain the grid frame is correctly placed over the imported data. Note that when creating a quadtree, SMS will not extrapolate for areas that are missing data. The newly generated grid will use the same projection as the Display Projection.

After you have a quadtree with the correct projection and unit, you can finish building your project. Having your quadtree in the correct projection significantly reduces the chances of encountering an error with your project.

These tips for using projections and quadtrees can be applied to other projects in SMS. Try them out in SMS today!

Blog tags: 

Pages