Aquaveo & Water Resources Engineering News

Aquaveo 2023

It's been a good year here at Aquaveo and a lot has happened that we're proud of, so we’d like to close out the year by reviewing some of our biggest highlights. We released new versions of our software, including new tools and features. We released SMS (Surface-water Modeling System) 13.3, WMS (Watershed Modeling System) 11.2, and GMS (Groundwater Modeling System) 10.8 beta.

Aquaveo 2023

Significant upgrades were made to the color ramp in the contour section of the display options. Many new pre-generated contour color and customization options were added to help you get your project looking just right. But for those of you who prefer to stick with what you know best, the old color ramp options remain available to you through the Legacy options button.

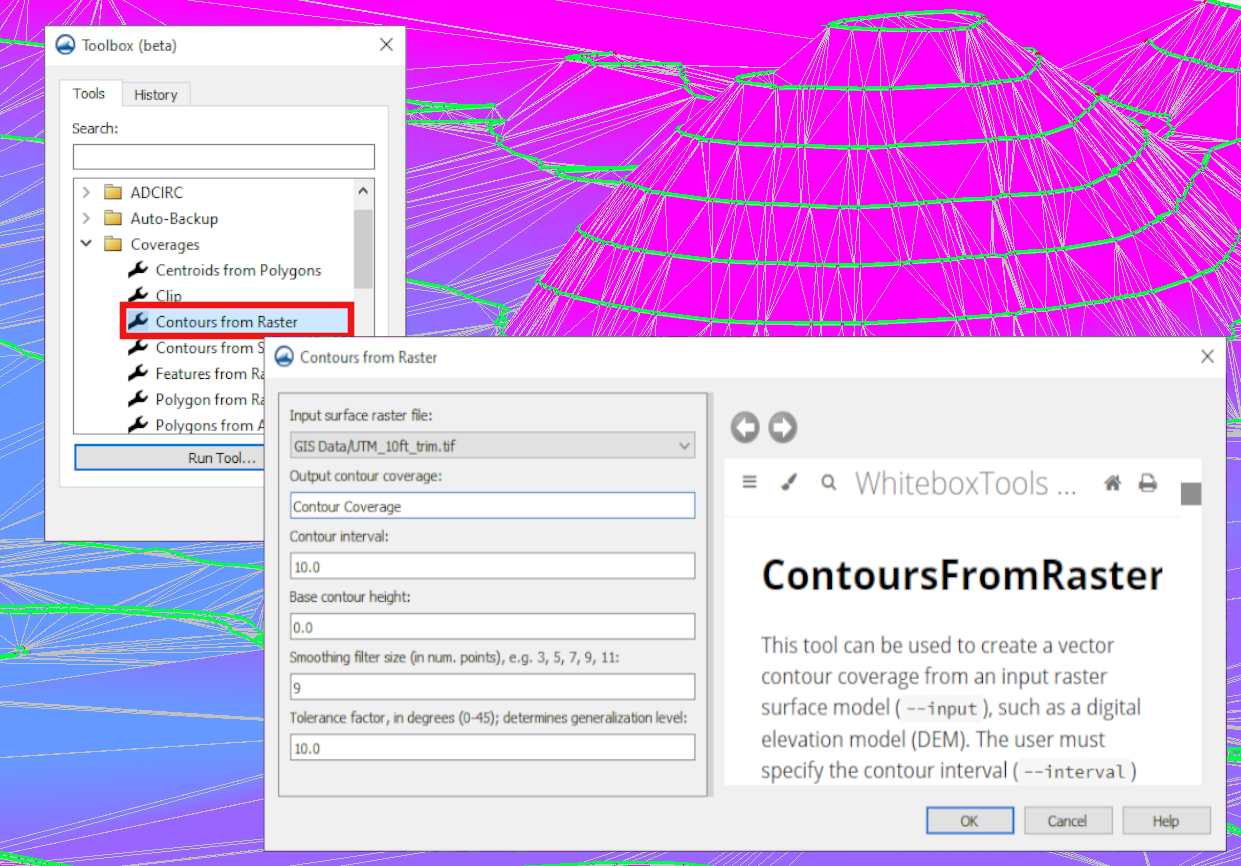
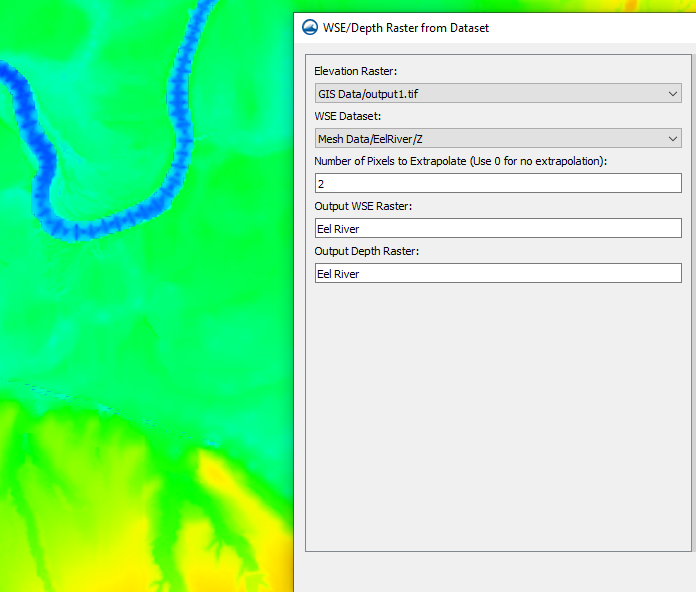
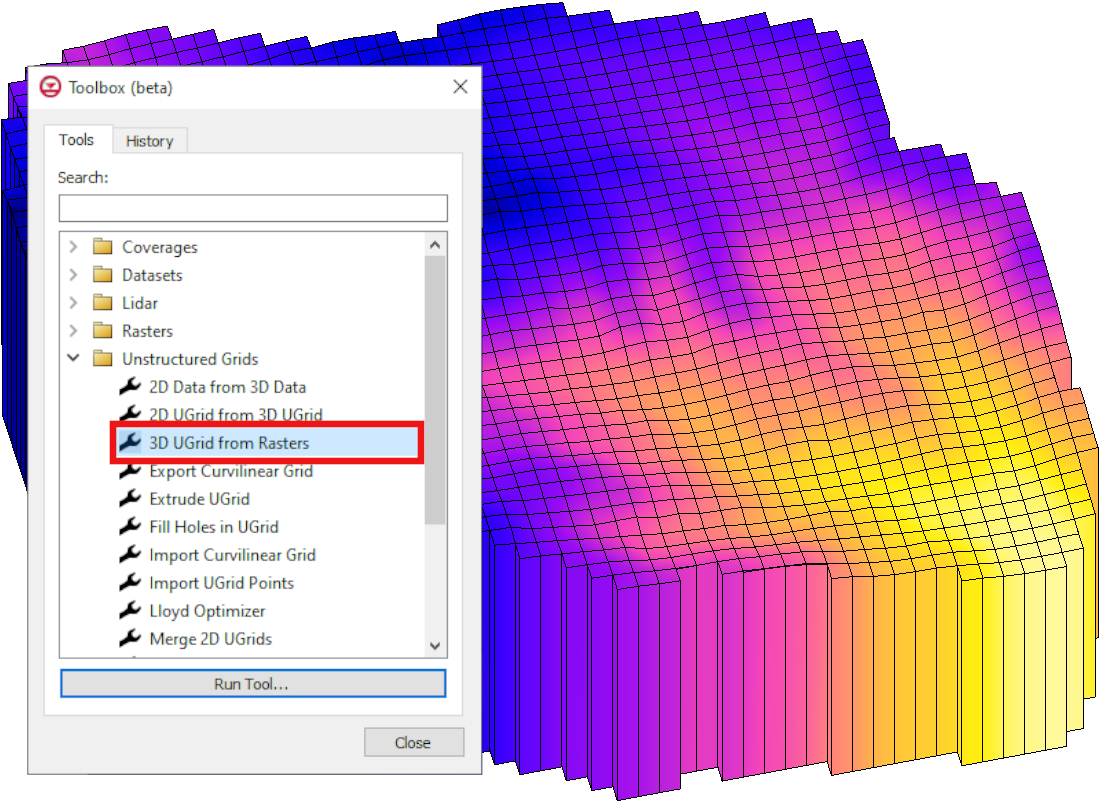
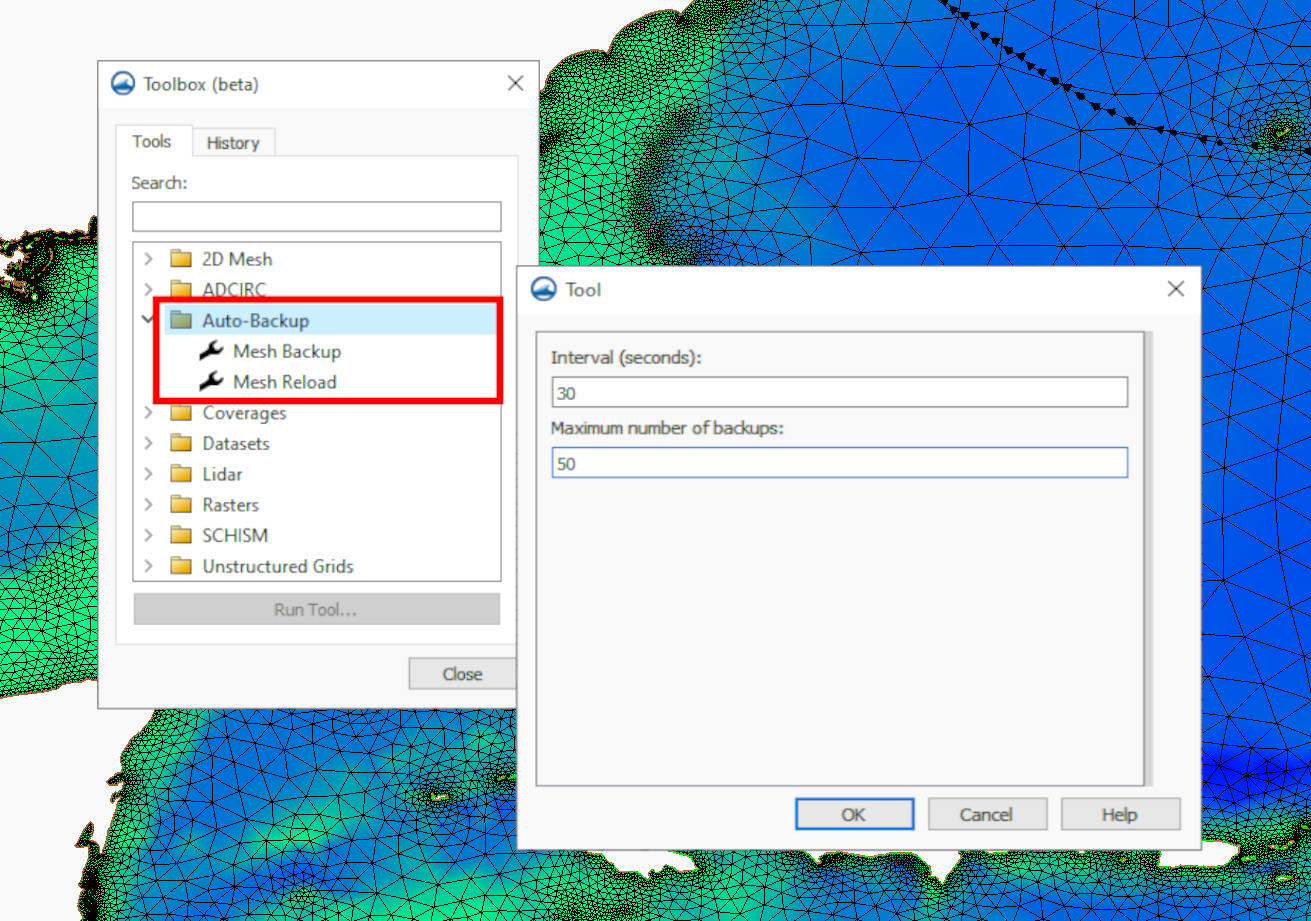
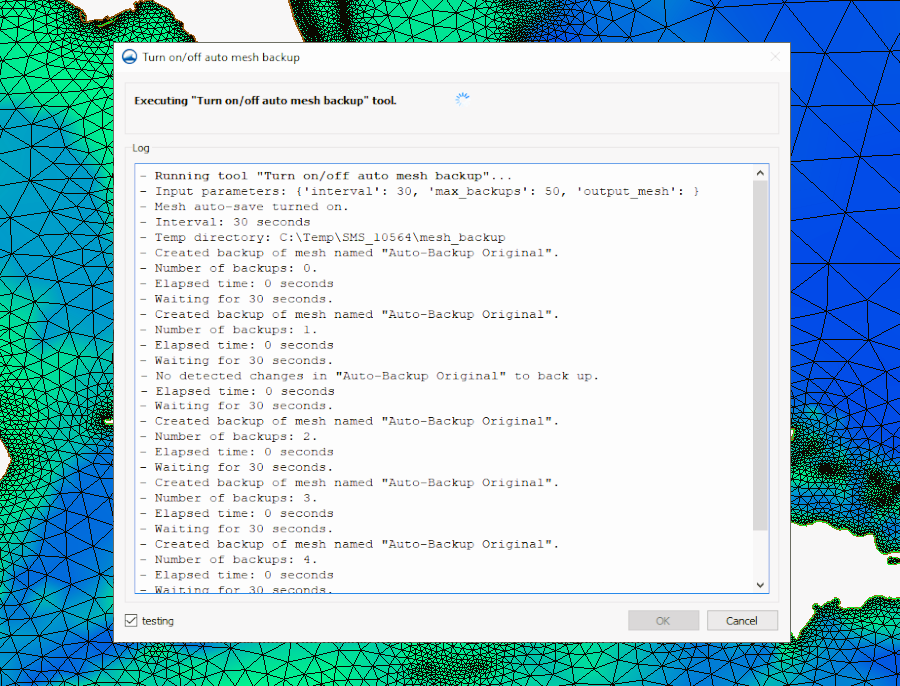
We're excited about what we've got going on in our toolboxes. The toolbox option has made it to WMS with version 11.2, and there are new tools in the toolboxes for GMS and SMS. SMS has tools for backing up meshes and restoring previous meshes., Both GMS and SMS have new tools for generating unstructured grids. This is just a sample of what has changed in the toolboxes. Take a look for yourself to see all the different tool options that have come with the newest versions of our software.

SMS 13.3 has new 3D structure modeling capabilities, which you can learn about on our wiki or use our new 3D Structures tutorials for a more hands-on learning experience. We've also added four new models in SMS 13.3's free community edition: ADCIRC, AdH, CMS-Flow, and STWAVE.

We partnered with Aquanty to bring the HydroGeoSphere model to GMS 10.8 beta. The HydroGeoSphere model can help you more accurately replicate the complex processes involved in the terrestrial part of the hydrological cycle.

WMS 11.2 now includes the WinTR-20 model in the TR-20 interface. WinTR-20 is an updated version of the TR-20 model used in both the WinTR-20 and TR-55 programs. You can learn about what this entails on our wiki, or by using our new tutorial on the WinTR-20 interface.

For Arc Hydro Groundwater (AHGW), we released a version that is compatible with ESRI's ArcGIS Pro. AHGW Pro contains significant updates to the arc hydro groundwater tools and makes use of ArcGIS Pro’s online platform.

We continue to develop our Tethys products, including CityWater. We were pleased to have released the Automated GSSHA Watershed Analysis (AGWA) , an online web application for managing watershed models.

We are also excited about our work with GEOGloWS and our other development partners. We are looking forward to our continued collaboration.

As excited as we are about what happened this past year, we’re even more excited about what 2024 will bring. We can tell you that there will be even more new tools in the Toolbox. We expect to release the full version of GMS 10.8 early in 2024. Also expect more new features for all of your favorite water modeling applications.

You've helped make this year a great one, and we hope you'll come along with us and do the same in 2024!

Blog tags: 

Contours from Raster and Features from Raster

Two new tools in the most recent version of theToolbox for Aquaveo’s GMS, SMS, and WMS (collectively known as XMS) are the Contours from Raster and the Features from Raster tools, which can be found in the “Coverages” folder of the toolbox. These tools can be a great way to use rasters to quickly generate coverages with contours or specific features such as streams and roadway embankments.

The Contours from Raster tool takes the elevation data from a raster and uses it to generate a contour coverage. This generates contours lines along the elevations at specified intervals. This can be useful for a number of things including, in some cases, a simple way to see where to define domains and boundaries for your project.

Contours generated from raster data

To generate this contour coverage using the Contours from Raster tool, you’ll need these components:

  • A surface raster file loaded into the project.
  • A contour interval you want for your project.
  • Base contour height appropriate for your project.
  • Smoothing filter size (in num. points), which should be an odd number.
  • Tolerance factor between 0 and 45 degrees. This determines the generalization level.

The Features from Raster tool generates features like streams and roadway embankments based on the elevation data from a raster. This tool can minimize the need to draw these features by hand. The inputs required for this tool are:

  • An input elevation raster loaded into the project.
  • The feature type which can be either stream or ridge.
  • The threshold area.
  • The pre-processing engine appropriate for your project:
    • rho8 – Computes flow directions and accumulations using the Rho8 algorithm.
    • Whitebox full workflow – Computes flow directions and accumulations using the Whitebox tool full workflow algorithm that uses a standard D8 method for computing flow directions.

Rasters often contain a large number of data points, so it may be beneficial to use the Smooth Raster tool or Feature Preserving Smoothing tool on the raster before using it to create contours or features. Alternatively, the Clean command can be useful for tidying up feature objects after the coverage has been generated.

Go to any of the XMS software to try out these new tools as a way to create coverages for your project today!

Blog tags: 

Two Tools for Creating a Raster from a Dataset

Do you have solution data that you want to export as raster data? The Surface-water Modeling System (SMS) provides two tools to help you create rasters from datasets. In this blogpost we will discuss the WSE/Depth Raster from Dataset tool and Raster from Dataset tool as well as the uses for both these tools and the differences between them.

Example of the WSE/Depth Raster from Dataset tool

WSE/Depth Raster from Dataset tool and Raster from Dataset tool are two separate tools in the SMS Toolbox. Each addresses the process of converting datasets to rasters, but with some differences.

To start, it should be noted that both tools are designed for creating raster data from solution datasets. This means that your project should contain solution data from a successful model run. Also, both tools allow you to define the pixel size of the resulting raster.

The WSE/Depth Raster from Dataset tool creates a raster based on water-surface elevation (WSE) or depth data. The tool requires that you have a geometry containing a WSE or elevation solution dataset in your project and that you have a raster containing the project elevation. It can extract both a WSE raster and a depth raster from a single tool execution. The tool is designed specifically to work with the bathymetry data. Other datasets may be converted incorrectly when using the WSE/Depth Raster from Dataset tool.

For other solution dataset on a geometry, the Raster from Dataset tool can create a raster from those datasets. This tool will work with datasets on various geometries including meshes, scatter sets, and unstructured grids (UGrids). The tool also allows you to use a raster template to define the output origin, activity, and possible resolution.

Now that you know some of the similarities and differences between the WSE/Depths Raster from Dataset tool and the Raster from Datasets tool, try out both of these tools and other features in the SMS Toolbox today!

Blog tags: 

Announcing GMS 10.8 Beta!

We are pleased to announce the release of GMS 10.8 in beta! There are many updates and additions that have been made in the newest version of GMS and this blog post will explore just a few of the new tools and functionalities.

HydroGeoSphere

HydroGeoSphere is a model brand new to GMS, which will be available to you in GMS 10.8 beta. The HydroGeoSphere model was developed by Aquanty to accurately replicate the intricate processes involved in the terrestrial part of the hydrological cycle using a three-dimensional control-volume finite element simulator.

3D UGrid from Rasters

The 3D UGrid from Rasters tool is new to the GMS toolbox. This tool is found under the Unstructured Grids folder in the toolbox, and can be used to generate a 3D UGrid using multiple rasters and a 2D UGrid. It creates layers between the rasters using the 2D UGrid and the horizons approach. When this tool is used, the resulting 3D UGrid has no vertical sub-discretization of the layers, and the horizontal discretization of all the layers is the same. More information about this tool can be found on this page of our wiki.

3D UGrid from Rasters tool
MODFLOW-USG Transport

MODFLOW USG Transport in GMS has new support for seepage elevation and concentration in the Recharge (RCH) package. The Evapotranspiration (EVT) package now supports ETFACTOR.

Color Ramp

The way the color ramp in the contour display options works has been updated, and many new color options have been added to GMS 10.8. The way the color ramp works has been changed to more closely resemble the changes that have already been made in SMS and WMS. If you want a more detailed explanation of how to use this version of the color ramp, you can check out this blog post. The blog post covers the color ramp for SMS, but the functionality is basically identical between SMS and GMS.

There are a lot of new things to try in GMS 10.8 beta, so download it from our website and check it out today!

Blog tags: 

Changing Ports for Aquaveo Licenses

Sometimes it may be beneficial to change the license location for one or more of our XMS (GMS, SMS, and WMS) software on your computer. There are a number of reasons to do this, including to increase security and flexibility. The port number has to be changed in two locations for the port to be switched over properly.

First, open the Aquaveo License Registration dialog. This dialog comes up when you first download the software so you can enter the licensing information. If you've already done this, the dialog can also be accessed by selecting Register… under the Help menu. After opening Aquaveo License Registration, do this to change the port number:

  1. Select the Advanced Options… button.
  2. At the top of the dialog, click the Change Location… button.

A dialog labeled Aquaveo License Registration – Change License Location will open. This dialog shows the IP address that is currently being used, as well as the current port number. This is where you can change the port number.

Changing XMS Port License

The other location the port number needs to be changed In order to switch over properly is the Aquaveo License Service Properties. Follow these instructions to open ALS Properties:

  1. Open the Services app. This can be found by typing "services" into the search on your taskbar.
  2. In the list of services, find "Aquaveo License Service" and select Properties.
  3. On the General tab at the bottom click Stop.
  4. In the Start Parameters, type the new port number with a backslash (\) in front of it.
  5. When you are finished, click Start.

The port location change won’t be complete until the port number is changed in both the Aquaveo License Registration and the Aquaveo License Service Properties.

Open any of the XMS software and check out how you can change the license location today! If you have more questions about licensing, contact our Licensing Support by emailing licensing@aquaveo.com.

Blog tags: 

Speed Up Edits Using Mesh Subsets

While working with meshes in the Surface-water Modeling System (SMS), you may have noticed that the more elements there are in the mesh, the slower the processing speed gets when making edits. Subset edit mode allows you to edit just one portion of the mesh at a time, which can increase the processing speed considerably. You can access the “Edit Subset” option by selecting the elements on the mesh you want to work with and right-clicking in the Graphics Window.

Using the Edit Subsit mode

Working within the edit subset mode was designed to let you work on a large mesh without overtaxing your machine’s memory and processing power. When you select a section of the mesh and enter subset mode, SMS will stop displaying the parts of the mesh that were not selected. This allows SMS to ignore the elements and data on the parts of the mesh outside of the subset. This can help free up computing power while making changes to the subset mesh. When you are done making your changes, you can exit the subset mode to have SMS include your changes in the full-sized mesh.

While in subset mode, the mesh in the Project Explorer will be tagged with the (subset) suffix. Some of the specific commands that you can use in subset edit mode are:

  • Commit Subset: this command takes you out of subset edit mode, and merges the changes made to the mesh subset with the rest of the mesh.
  • Revert Subset: this command takes you out of subset edit mode, but does not retain any of the changes made to the mesh subset.

You may notice that "Refine" is listed as an option in the right-click menu while subset edit mode is active, however you are not able to refine elements in a subset. If you select "Refine" an error will appear stating "Command not available in subset edit mode."

Some actions that you are not able to perform while in subset edit mode are:

  • Making changes on the border of the mesh subset.
  • Creating a new mesh.
  • Running a numerical model.
  • Changing attributes such as boundary conditions on nodes, nodestrings, and elements.
  • Renumbering node/nodestring/element IDs.

Head over to SMS and see how subset edit mode speeds up the processing time when editing large meshes today!

Blog tags: 

Utilizing the Transient Step Function Method

The Groundwater Modeling System (GMS) provides tools for working with transient MODFLOW simulations. When working with transient dataM in a MODFLOW model, it is important to understand stress periods and how GMS calculates their values. There are two different methods you can use to define the values for a stress period: the continuous time series method, and the step function method. This blog post will cover how to input the data for a stress period in the XY Series dialog so that GMS will calculate their values correctly.

Transient MODFLOW simulations use time intervals called stress periods to define the values of transient stresses such as pumping rates, and river stages. The values for stress periods are entered in the XY Series dialog, which is opened from the Attribute Table dialog. For a continuous time series, you need to enter only one data point per time step. When you enter only one value per time step, GMS assumes that the value continues to increase through the stress period, creating a straight line connecting the two points for a smooth transition. But because GMS needs a constant value for each stress period, it will take an average of the starting values of that particular stress period and the starting value of the following stress period.

The step function method tells GMS that there is only one value for each stress period, rather than a continuously increasing value. To input data in the XY Series dialog so that GMS knows that there is only one constant value through the entire stress period, you’ll need to enter both a start value and an end value. The figure below shows an example of the format to use.

Step function in GMS

As you can see in the above figure, you need the end value of a stress period to match the start value of the following stress period. This creates "steps" in the data, telling GMS to read a constant value through the entire stress period, rather than having a gradual increase from beginning to end.

Head over to GMS and try creating a step function for your transient MODFLOW model today!

Blog tags: 

Creating Reliable Arc Pairs for SRH-2D

SRH-2D models in the Surface-water Modeling System (SMS) often use pairs of arcs to represent structures like culverts, weirs, bridges, and gates. For some projects, it matters for SRH-2D about how these arc pairs are drawn, and improperly drawn arcs can stand in the way between you and a successfully run model.

Arc pairs in SRH-2D models need to be drawn from left to right as if you are looking from upstream to downstream. This can get quite confusing, so here are a few tips for how to be able to tell which direction your arcs need to go by making use of display settings in the Display Options dialog.

Using vectors to find stream direction

If you’re not sure which direction is upstream and which is downstream, select 2D Mesh from the list on the left of the Display Options dialog and turn on Vectors. This requires having a dataset associated with the mesh that contains vector values. The vectors will display the direction the water is flowing, which makes it easy to be able to tell where upstream is. Now, to draw the arcs in the correct direction, imagine you are standing upstream and looking downstream. Then start the arc on your left and end it on your right. Both arcs need to be drawn in the same direction.

What do you do if you’ve already drawn the arcs and then you try to run your simulation and it fails? If the failure is caused by misdrawn arcs, the error will read "Program stopped due to the following: Linked Pair nodestring direction is wrong; please reverse them". The fix is simple if you have only one pair of arcs on your mesh: select both arcs in the Graphics Window, right-click, and select Reverse Arc Direction.

The Reverse Arc Direction command

However, the existence of more than one arc pair can make solving this error a little more complicated. Rather than going around and either redrawing or reversing all the arcs, here's what you can do to pinpoint the problematic pair. First, open the Display Options dialog. On the Map tab check the box next to Annotations and click the Options button. In the Arc Annotation Options dialog, turn on Show arc direction arrow. Doing this will add arrows to the arc, pointing toward the end. This makes it easy to look at the arcs and see which ones are facing the wrong direction, at which point you can use the same steps as above to reverse the arc direction.

Head over to SMS and use this guide to help your SRH-2D model run more smoothly today!

Blog tags: 

Using Mesh Auto-Backup

Needing to save and reload older versions of your 2D mesh in the Surface-water Modeling System (SMS)? SMS 13.3 has a new set of tools that let you do just that. The Auto-Backup folder included in the Toolbox contains the Mesh Backup and the Mesh Reload tools. These tools let you save past versions of a 2D mesh while you are editing the mesh. If you discover a change to the mesh was undesirable, you can load a version of the mesh before the change was made.

SMS uses 2D meshes for a wide variety of models including, but not limited to, ADCIRC and SRH-2D, as well as generic models. Using the new Auto-Backup tools, you are free to make as many edits to the mesh as you need knowing you can recover the previous versions. This blog post reviews how the Auto-Backup tools work.

Mesh Backup Tool
The auto-backup tools

The Mesh Backup tool creates a series of backups at specified intervals for a specified number of iterations. Both the interval and the number of backups are determined by the user in the tool’s dialog. The default values are a mesh backup every 20 seconds, 10 times. These values can be changed to whatever works best for your project, however, it is recommended that you limit the amount of backups to roughly 200 or less.

When you run the tool, a dialog labeled Turn on/off auto mesh backup will appear. This dialog means that the tool is on, and will run in the background while you work on your mesh. This dialog is intended to stay open while you work on your mesh. Clicking Cancel will turn off the tool. While the tool is running, SMS checks to see whether or not a change has been made to the mesh every time the specified time interval has elapsed, and then creates a backup copy.

Running the mesh backup

The log portion of the Turn on/off auto mesh backup dialog keeps track of how many backups have been made for the mesh. It will also tell you if there was an interval where no changes were made to the mesh. In cases where no changes were detected, a backup copy of the mesh during that period will not be stored.

Mesh Reload Tool

The Mesh Reload tool is where you can access the mesh backups. Naturally, this means that you have to run the Mesh Backup tool before anything will be available to reload. The Mesh Reload tool dialog contains a dropdown menu with all the backup meshes labeled by timestamp. The dropdown menu will often not contain every single time stamp, because there will likely be some time stamps where no changes to the mesh have been made.

Using the Mesh Reload tool does not erase the current mesh, or backtrack any changes that you’ve made. It will simply add a copy of what the mesh looked like at that time stamp under the "Mesh Data" folder in the Project Explorer. Try out the new Auto-Backup tools in SMS 13.3 today!

Blog tags: 

Solution for Overlapping Points in MODFLOW

When using the Groundwater Modeling System (GMS), it is important to understand how cells work in MODFLOW models, especially with conceptual models. Conceptual MODFLOW models are defined using feature objects such as points, arcs, and polygons on a grid. GMS processes each feature object separately, and occasionally there may be more than one feature object in a cell. MODFLOW is able to handle more than one boundary condition in a cell simultaneously, however, there are some things you should note.

The use of coordinates is essential to GMS as a whole, but not to MODFLOW. GMS uses coordinates to keep track of the exact location of feature objects relative to each other, as well as relative to the grid and other model data. Because the cell is the smallest unit of measurement in MODFLOW models, it only cares about the contents of the cell and not the specific location within it. All feature objects within the cell are mapped to the cell center and used for the cell calculations simultaneously.

When importing MODFLOW data that wasn't created in GMS, there are no coordinates tied to that data, so GMS uses the cell center as a reference and places all points there. This poses a problem as GMS requires that all points are assigned to unique coordinates, so GMS will generate an error message if any two or more points share an x, y, and z location. The way to fix this is pretty straightforward, although it can become tedious depending on the number of points on your grid. To solve this problem, follow these steps:

  1. Open the Attribute Table dialog by double-clicking on a point in the Graphics Window.
  2. Make sure the Feature type is set to "Points", and the Show dropdown is set to "All".
  3. Check the box next to Show coordinates.
Overlapping points in MODFLOW

Now you can identify which points share the same coordinates and make the necessary changes. GMS only cares if more than one point has exactly the same coordinates in the x, y, and z directions. Offsetting a point even slightly in one of the three directions is enough for GMS to no longer have a problem, and the calculations will come out the exact same as long as the point remains within the original cell.

Head over to GMS and use these tips to make sure your MODFLOW simulation runs smoothly!

Blog tags: 

Pages