Aquaveo & Water Resources Engineering News

Plotting Conductance for the DRN Package

Are you looking for a way to contour the conductance of drainage areas in your groundwater model? If you have a large regional model containing areas with a dense drainage network (ditches, tile drainage, etc.), you can scale up this to represent a diffused drainage system. When doing this, there are not only single ditches simulated with the drain (DRN) package, but whole areas. Using GMS, you can create a contour of these drainage areas.

Contoured drain area

To create this contour, use the following workflow:

  1. Go to MODFLOW | Optional Packages | DRN to open the Drain (DRN) Package dialog.
  2. Make sure IJK is selected on the bottom in order to have the drains at their XYZ locations.
  3. Click the top left blank grey box to select all or select and drag to select all the data points.
  4. Copy the data and paste in a word processor such as Notepad++ and save the file.
  5. Back in GMS, select Open File and select the new text file. The text wizard should open up and already have delimited the file, but double check to make sure all the values are correct.
  6. Click Next then change the GMS data type to 3D Scatter points.
  7. If your file included elevations, you can make sure those are not mapped into your project by changing the dataset above to "Not Mapped".
  8. Otherwise, make sure your IJK cell values are matched up with their respective XYZ values and your conductance is set as the "Dataset".
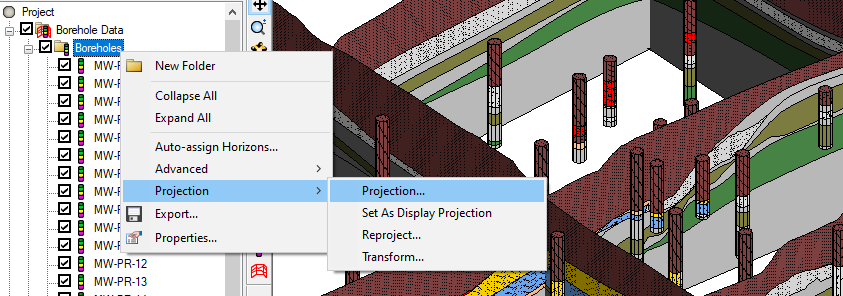
  9. You may have to select the projection for this dataset in order for it to line up with your current project.
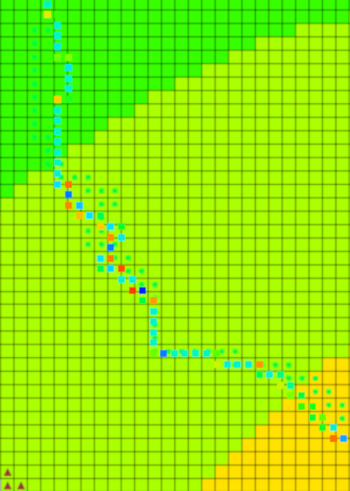
  10. You can then go to Display Options, select 3D scatter points on the left sidebar, and then turn on Contours if it has not already been turned on. You can check the contour options to see if the setup and coloring is to your liking.

Completing this workflow should cover all the drain points within the MODFLOW project. Try out contouring drainage areas in GMS today!

Blog tags: 

Using Shapefiles for Stream Arcs in WMS

Shapefiles contain valuable data that can be used for modeling in WMS. If you have an existing shapefile that has arcs that define the streams for the area you will be modeling, you can use that shapefile to define the streams in your WMS project. Doing this can save you from manually having to define the stream arcs manually.

Do use a shapefile for stream arcs in WMS, do the following:

  1. Import or download the shapefile into WMS. The file data will appear in the GIS module. Review the arcs to make certain they align with the stream location.
  2. With the shapefile active, use the Mapping | Shapes to Feature Objects command.
  3. In the GIS to Feature Objects Wizard, map the shapefile to the drainage coverage. If you are using another coverage besides the drain coverage make certain to select the correct coverage in the first step of the wizard.
  4. After mapping the arcs to the drainage coverage, use the Select Feature Arc tool to select arcs along each stream.
  5. Right-click and select the Attributes command to open the Attributes dialog for the selected arcs.
  6. Change the attributes of the arcs to be Streams.
Converting the arcs to stream arcs

After creating the stream arcs, it is recommended that you review the streams to make certain the streams going in the right direction. Use the display option to see the stream arc direction and use the Reverse Direction command to change the direction of arcs.

It is also recommended that you carefully review the arcs that were mapped over to the drainage coverage. Delete any unnecessary arcs and clean up the arcs to improve the performance of the model. It is recommended that stream arcs be merged together except in locations where they branch or where a subbasin is meant to start. Merge arcs by changing a node to a vertex.

Shapefiles can help you build your watershed project in WMS quickly Try out creating stream arcs from shapefiles in WMS today!

Blog tags: 

Using the Compute Derivative Tool in SMS

With the release of the SMS 13.1 beta, a new tool has been added to the Dataset Toolbox. The Dataset Toolbox contains many tools for creating new datasets from existing data in your project. The Dataset Toolbox contains the Data Calculator as well as tools for comparing datasets and completing certain functions.

Among all the tools currently available, the Compute Derivative tool has been added to the Temporal tools in the Dataset Toolbox. In a previous blog post we discussed the other temporal tools if you want to review the function of those tools. The Compute Derivative tool allows you to create a new dataset showing the change from one time step to the next, or the derivative from one time step to the next of an existing dataset.

To access and use the Computer Derivative tool, do the following:

  1. Have a transient dataset loaded into the project.
  2. Use the Data | Dataset Toolbox command.
  3. In the Dataset Toolbox dialog, select the Computer Derivative tool under the list of Temporal tools.
  4. Select the desired dataset to use for the computation.
  5. Select either the Change or Derivative option.
  6. If selecting the Derivative option, also specify the time units.
  7. Enter a name for the new dataset.
Compute Derivative Tool in SMS

The new dataset generated from the Computer Derivative tool will output data in between the existing dataset time steps, resulting in one fewer time steps than the original dataset.

The Compute Derivative tool is only available for data that is in the 2D Mesh module or the UGrid module. Make certain that you have your dataset included in one of these two modules. If you have your dataset in a different module, you will need to interpolate it over to a 2D mesh or UGrid (unstructured grid) before using the Computer Derivative tool.

Try out using the Compute Derivative tool in SMS 13.1 today!

Blog tags: 

Troubleshooting Importing Boreholes in GMS

Have you encountered issues when importing borehole data into GMS? The majority of the time, there are no issues when borehole data is imported into GMS, but occasionally something becomes misaligned. This article will attempt to address some of the common issues that occur when importing borehole data.

The most common issue happens when the borehole data file is formatted incorrectly for GMS. Often this can be fixed when importing the borehole through the File Import Wizard. Selecting the correct options in the File Import Wizard can resolve many issues. However, in some cases the borehole data will need to be reformatted using a spreadsheet program or text editor. If this is the case, follow the recommended borehole file format.

Another issue occurs when importing borehole data happens when the coordinate system for the borehole data does not match the coordinate system for the GMS project. When this happens, all of the boreholes will be unaligned with the project data or it may happen that all of the boreholes will be stacked on top of each other. This latter case typically occurs when the borehole coordinates are in latitude and longitude, but the GMS project is using a projected coordinate system, which would use linear units such as feet or meters.

To fix this issue, the correct projection needs to be set for the boreholes. This is done by doing the following:

  1. In the Project Explorer, right-click on the imported boreholes and select the Projection command.
  2. In the Object Projection dialog, set the projection to match the project projection.

With the correct projection set, the boreholes should line up with the project data.

Setting projections for a borehole

Additional adjustments to boreholes can be made using the Borehole Editor. This is accessed by right-clicking on the borehole and selecting the Properties command. This method is best when only a few boreholes are imported incorrectly. If several or all boreholes were imported incorrectly, it is recommended to review the borehole data and fix any issues before importing into GMS.

For further troubleshooting with importing borehole data, contact our technical support team at support@aquaveo.com. Try out using boreholes in GMS today!

Blog tags: