Aquaveo & Water Resources Engineering News

Tips for Using the Data Calculator in GMS

The Data Calculator in GMS is a powerful tool that allows you to generate new datasets from existing data.

The Data Calculator can be used to to create datasets that show:

  • The difference between model runs
  • The minimum or maximum of two datasets
  • An aquifer's water level
  • And many other applications

To help you get the most out of the Data Calculator, here are some tips for using this tool.

Datasets can be added to the expression by either double-clicking the dataset in the Dataset section of the calculator, or selecting the dataset and using the Add to Expression button. Make certain you are selecting the correct dataset before adding it to the expression.

When adding operators to the expression, be careful. Double-clicking the operator buttons will enter the operator into the expression twice. If this happens, be sure to delete the additional operator before computing the dataset.

Operators in the Data Calculator

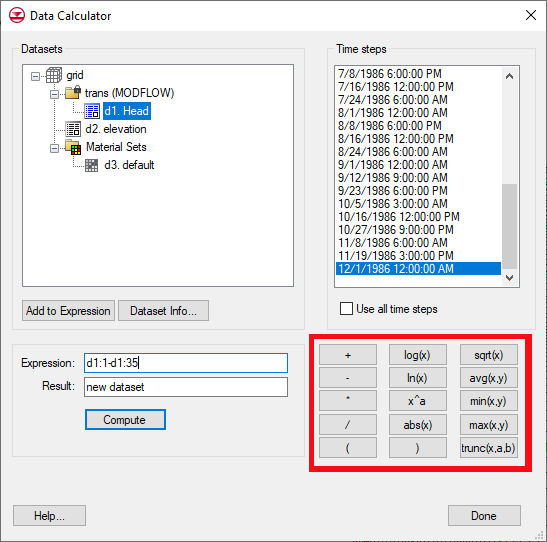
Review datasets before using them in the Data Calculator. This can be done before starting the Data Calculator by using any of the available tools in GMS. Once in the Data Calculator, you can review datasets by selecting the dataset and clicking the Dataset Info button.

When adding a dataset to the calculation, either specific time steps can be used or all time steps can be used. When using specific time steps, select the desired time steps before adding the dataset to the equation, or enter the dataset number followed by a colon and the number of the time step.

Using a specific time step is the default option. To use all the time steps, select Use all time steps before adding the dataset to the expression, or enter the dataset number followed by a colon and the word "all".

Now that you know a little more about the Data Calculator, try it out with your projects in GMS today!

Blog tags: 

Using Command Line Switches for the XMS Installer

If you work as a system administrator or in an IT department, you may need to know how to install GMS, SMS or WMS silently or with less visibility. Fortunately, we have a few options for this.

Previously we have discussed performing a silent install of XMS, this article will discuss options that run as command line switches. For example, when running the WMS 11.0.5 installer with no UI, you will enter the command "wms11.0.5full64bit.exe/qn" through cmd.

When installing XMS, you have the following parameters you can set:

full UI: /qf

This is the default parameter used by the installer. This means that the end user will see the full installation wizard the same way they would by running it through Windows Explorer.

reduced UI: /qr The user interface does not show any wizard dialogues.

This is a form of automatic installation that will skip all wizard dialogues, though you will still see a full UI showing that WMS is being installed.

basic UI: /qb Only a progress bar will be shown during the installation

Command line install progress bar

This option is similar to /qr but, instead of showing the full UI from our installer, it shows a progress bar with default Windows installer decorations. This takes less screen real estate while still giving you visibility into the installation process.

no UI: /qn No UI will be shown during the installation.

This option does not show any UI at all, instead opting to run the install progress in the background. This is ideal for if you are installing the software on a computer that's currently in use and don’t want to interrupt the work currently being done.

Current versions of XMS software can be found on Aquaveo's downloads page.

Blog tags: 

Utilizing Data Modification Tools in SMS

The Dataset Toolbox in SMS allows viewing your data in many different ways, while also being used to modify and create new datasets from already existing datasets. The different tools in the toolbox each use a specific set of functions to modify selected datasets.

One tool in the Dataset Toolbox that can prove to be helpful is the Filter tool. This tool creates a new dataset based on the selected filtering criteria.

For example, say you are filtering your numeric model output to show depths between the minimum and maximum depth, then you wish to filter the depth data for velocity between minimum and maximum range. This tool could help to show how a fish habitat changes over time or for any other purpose you can think of.

There may be multiple ways to accomplish this task, but one method would be to filter the velocity dataset to the desired range and then map that activity to the depth dataset. Using this example, you could do the following:

  1. Open the Dataset Toolbox.
  2. Select the Filter tool.
  3. Use the tool to filter the Velocity Mag dataset to the desired range and apply NULL outside the range.
The Filter tool in the Dataset Toolbox

The Map Activity tool is another tool that can be helpful. This tool maps the activity from one dataset to a second dataset. It helps show only the values of interest on a particular dataset. To continue the previous example:

  1. Select the Map Activity tool in the Dataset Toolbox.
  2. Using the dataset created in the previous steps, map the activity from the new dataset to the depth dataset (Value Dataset).

The new dataset will appear in the Project Explorer, showing the values of interest. If the dataset is a transient then a film loop could be made, showing how it changes over time.

The Filter and Map Activity tools are only two of many tools available in SMS’s Dataset Toolbox. Try out these tools and others in SMS today!

Blog tags: 

Exploring Hide, Show, and Isolate in GMS

Many projects in GMS can end up being visually busy. Having a large grid and dozens of features can make it hard to see specific areas clearly. To help with this, GMS provides the Hide, Show, and Isolate functions.

How to Hide Cells

This feature allows you to select different project cells and simultaneously hide them from view in the Graphics Window.

  1. Select the individual, or group of cells that need to be hidden.
  2. Once it is highlighted, click the Hide macro in the toolbar, or right-click and select the Hide command.

Remember that when cells are hidden from view this does not mean they have been deleted from your project entirely. Even if they are not visible it is only necessary to select the Show macro on the toolbar and the hidden cells will reappear.

Also, hiding cells does not make those cells inactive. They will still be included in your model run.

How to Show Cells

To reverse the hidden elements, click the Show macro in the toolbar and any hidden cells in your project will reappear. This can be important if you have inherited a project and suspect there are hidden cells.

Isolating Cells

Isolating cells hides cells that are not selected, unlike Hide which hides the selected cells. To isolate cells:

  1. Select the cells in the Graphics Window you wish to isolate.
  2. Once cells are highlighted, select the Isolate macro on the toolbar, or right-click and select the Isolate command.

Using a Polygon

Another option for isolating or hiding cells is to use a polygon in the map coverage. To do this:

  1. Right-click on the selected polygon.
  2. Click Select Intersecting Objects from the menu that appears.
  3. In the Select Objects of Type dialog choose the geometric object to use.
  4. With the cells selected, you can now use the Hide or Isolate function.
Isolating cells using a polygon

Try using the Hide, Show, and Isolate features in GMS today!

Blog tags: