Aquaveo & Water Resources Engineering News

Community Pinewood Derby

Recently, Aquaveo’s Provo office participated in a Pinewood Derby race with several other local companies. For those unfamiliar with the sport, it involves racing small wooden kit cars down a track. The tradition in Cub Scouting was begun nearly 65 years ago in Manhattan Beach, California.

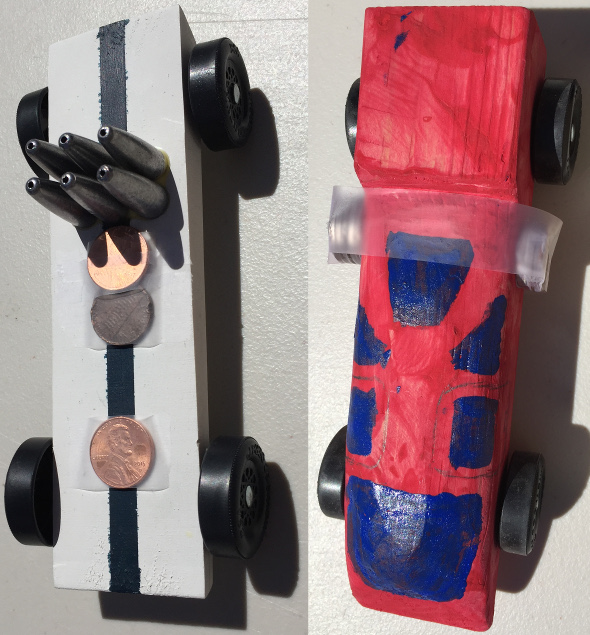
As anyone familiar with the pinewood derby can attest, it requires some engineering know-how to create a speedy car from a block of wood. Getting the proper shape for the car, placing the correct amount of weight in the right location on the bottom of the car, and establishing the correct wheel balance and alignment are all important factors to consider. All of this is done to make the cars go as fast as possible without them wobbling off the side of the track or skidding along the edge of the track.

The other companies participating included HadCAD, Charity Vision, Jones T-Shirts, Link Trust, Alpha Solar, and Sawtooth Software.

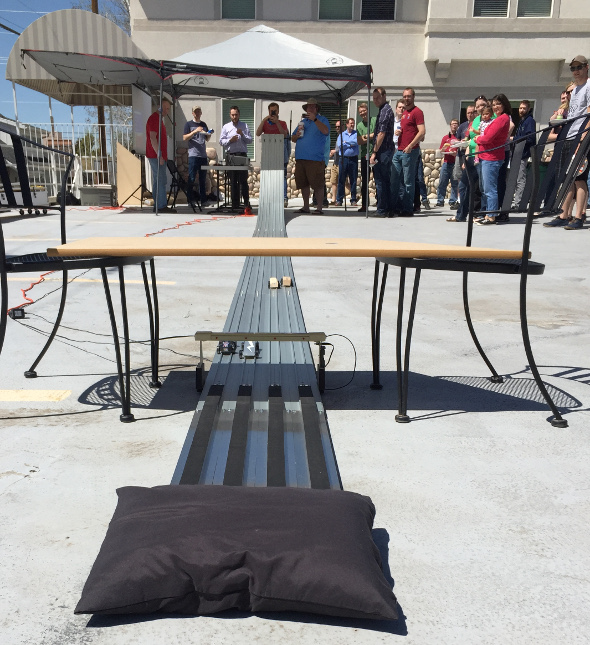
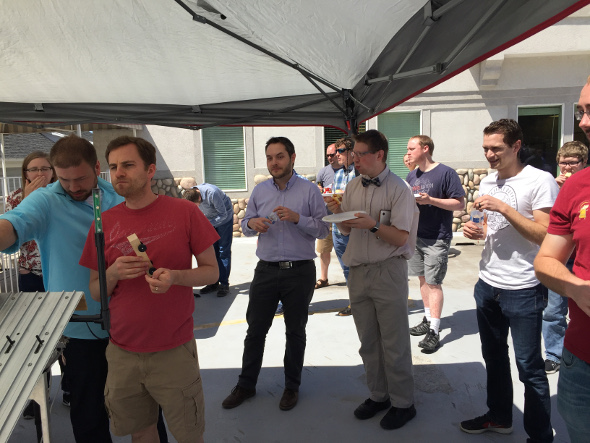
Around a dozen cars were entered, and each ran four races--one on each track. The slowest time was discarded and the car with the fastest average time won. Two of the cars employed 3D printing: a red one with a full 3D printed shell that fit snugly over the top of the base wooden block, and a Batmobile with a 3D printed airfoil and Batman figure. One of the most creative was a car designed to look like a pinewood derby car on a track.

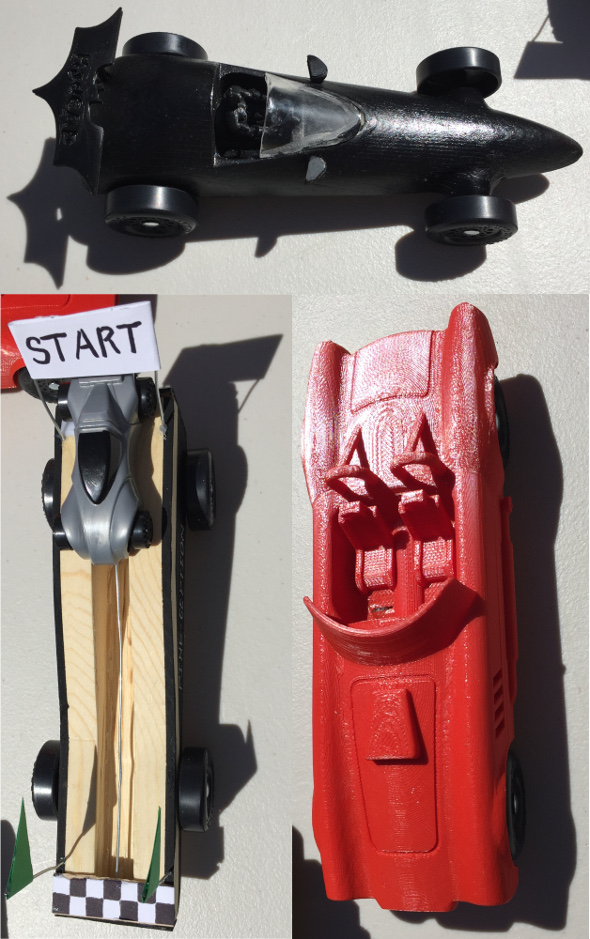
We had two entries from Aquaveo employees: a silver and black car designed by Gage Larsen (Testing Manager), and a red and blue car designed by Steven Estep (Technical Support). Steven’s car finished in 6th place overall.

We look forward to another race next year.

Exporting Raster and Vector KMZ Files

Need to open your project data in Google Earth? GMS can do that by generating a KMZ file from your project data.

GMS allows creating either a raster KMZ file or a vector KMZ file.

Raster KMZ File

This option saves the project data as an image with georeferencing data. The data is clipped to match the current view in the Graphics Window.

To create the file:

  1. Switch to Plan View.
  2. Check that you are using geographic coordinates, otherwise it may be distorted.
  3. Use the File | Save As command.
  4. Set File of Type to be "Google Earth Raster KMZ File (*.kmz)".
  5. Select the Options button to set the resolution.

When pulled into Google Earth, a raster KMZ will simply display the file data as an image over the georeferenced location.

Vector KMZ File

This option saves the project data as vector information. All visible data in the Graphics Window will be included. Points, lines, and polygons will be saved in the file along with the georeferenced data.

  1. Switch to Plan View.
  2. Use the File | Save As command.
  3. Set File of Type to be "Google Earth Vector KMZ File (*.kmz)".

When imported into Google Earth, a vector KMZ will contain an image over the georeferenced location, along with a layers for any lines, points, or polygons contained in the file. These layers can be toggled on or off.

Transient Data

Transient data in GMS can be exported as a raster KMZ file animation.

  1. Switch to Plan View.
  2. Check that the project is using global coordinates.
  3. Select the Display | Animate command.
  4. In the Animation Wizard, turn on the KMZ file option.
  5. Set the options for where to save the file and what parameters to use.

After GMS generates the animation, you can open in Google Earth to see the results.

Now that you’ve seen how KMZ files can be generated, go ahead and give it try in GMS today.

Blog tags: 

2 Ways to Import ArcGIS Files into WMS

ArcGIS software has long been a standard in generating geographic data. It is likely you will have received a shapefile generated in ArcMap at some point. ArcGIS files can be imported into WMS to save you time in recreating geographic data.

There are two main methods for importing ArcGIS data: through the standard open dialog or through the GIS module.

Standard Method

To import ArcGIS files into WMS:

  1. Select the Open command in the File menu.
  2. Make certain the Files of Type field is set to "All Files" or "Shapefiles".
  3. Browse to your file and open it.

That’s all you need to do. You can also use any other standard methods for opening files such as using the Open macro or dragging the file onto the Graphics Window. There is also a command to open shapefiles in the Data menu in the GIS module.

Right-clicking on the the imported shapefile in the GIS module allows joining table and layer data. This data can then be mapped onto a coverage using the Shapes → Feature Objects command in the Mapping menu.

A grid coming from ArcGIS will be imported as a DEM in the Terrain Data module . A TIN will also be imported into the Terrain Data module.

GIS Module

When the GIS Module is active, you can use commands to directly import ArcGIS data into WMS. To do this:

  1. Make certain the GIS module is active.
  2. Select the Data | Add Shapefile Data command.

  3. or

  4. Select the Data | Add GIS Data command.
  5. Use the file browser to locate your files and import them.

This second method is useful for a wider range of ArcGIS data files. If a file does not open correctly using the standard methods, then importing the file through the GIS module is recommended.

DEMs and TIN files opened through the GIS module will be imported into the GIS module instead of the Terrain module.

Take a look at what other GIS tools are offered in WMS.

Blog tags: 

Using Snapping in SMS

In many projects, you might find a need for nodes or vertices to line up exactly. You can achieve this by using the Snapping feature in SMS. Snapping nodes to arcs can be accomplished two ways in SMS: by cleaning and by using the snapping crosshairs. In some cases, two arcs might need to be very close to each other but not snapped to the same nodes or vertices on a mesh. This post will discuss how all of this works.

Clean Option

The Clean option allows any two nodes on the same coverage to be "snapped" together To snap two nodes on the same coverage:

  1. Select the desired nodes.
  2. Select the Clean... command from the Feature Objects menu.
  3. In the Clean Options dialog, turn on Snap selected nodes.
  4. Select the desired node as the snapping point.

The nodes will be merged into one node at the desired location.

Nodes and vertices can also be snapped using a tolerance value. This will snap all nodes in the coverage to be within the tolerance.

  1. Select the Clean... command from the Feature Objects menu.
  2. In the Clean Options dialog, turn on Snap nodes and vertices.
  3. Set the Tolerance level.

The tolerance units are the same as those set in the projection. This method may cause vertices to be redistributed along some arcs, so it should used carefully.

Snapping Feature

If Snapping is turned on the Map tab in the Preferences dialog (see image below), red crosshairs (see image below) will appear when creating an arc and the mouse moves near an existing node or vertex. This indicates that the node or vertex will snap to the existing node or vertex in the coverage. If two vertices snap, they turn into a single node. Snapping can be turned on and off when in the Map module by pressing "S" on the keyboard.

Snapping Across Multiple Coverages

To snap across multiple coverages, Inactive coverages must be turned on in the Display Options dialog. This prevents nodes or vertices from appearing to be snapped when they are not (see the images below). The first shows what appears to be two vertices that are snapped. The second shows a zoomed view showing they are not actually snapped.

Snapping can also occur between a coverage and a geometry such as a mesh or a grid.

Nodes That Should Not Be Snapped

Keep in mind that if two boundary arcs are close to the same node(s) on the mesh or grid, a simulation may snap them to the same node(s) within the simulation, which may cause errors. This can be fixed by either refining the mesh or grid so there are more nodes to use, or by moving one or more of the arcs slightly.

Try using the snapping feature today in the Community Edition of SMS.

Blog tags: 

Creating a Transient Animation

After creating a transient dataset, it can be time consuming to click through each time step to evaluate the changes over time. One of the fastest ways to view changes in transient data is to create an animation.

Creating an animation in GMS can be done quickly using the Animation Wizard.

Once you have a transient dataset with multiple time steps in your project, do the following:

  1. Select the dataset you want to animate and make certain your project is displayed how you want to see it in the Graphics Window. The animation will be created from what is visible in the Graphics Window.
  2. Select the Animate command in the Display menu to open the Animation Wizard.
  3. In the first part of the Animation Wizard, select where you want to save your animation, what file type you wish to use and the animation quality.
  4. In the second part of the Animation Wizard, set your time duration and add a display clock. The options here will vary depending on what options were selected in the first part of the Animation Wizard.
  5. When you click Finish, GMS will create your animation.

If you selected the AVI file format, GMS will display it for you in the Play AVI Animation application (Pavia). This player is included with your installation of GMS. If you selected the KMZ format, GMS will display your animation in Google Earth (if it is installed).

Once you’ve created an animation, you can view it again when you reopen the project. To do this, select the Play Animation command in the Display menu. This will tell GMS to locate the animation file associated with the project and open it in the AVI player. This operation only works for AVI files.

Files can be exported in either AVI format or KMZ format. The AVI file can be used with most other video players, including Windows Media Player or QuickTime Player. KMZ files can be opened with Google Earth.

With the basics down, you can now try creating animations for your own projects in GMS.

Blog tags: