Using the Import Wizard to Create a Cross Section Database
By aquaveo on March 3, 2021Do you have a cross section database that needs to be included in your surface water project? A new feature in SMS 13.1.1 beta allows you to import a cross section database using the File Import Wizard.
A cross section database can be imported from a spreadsheet or a specially formatted text file. To import a cross section database from a spreadsheet or text file, use the following steps:
- Make certain you have created a 1D hydraulic cross section coverage in your project. This is needed in order to have a place to store the cross section database.
- If using a text file, make certain it is formatted correctly. It should include an XS ID or Station ID column in order to define the points found in each cross section.
- Open the cross section database file using any of the methods for opening a file. This will bring up the File Import Wizard.
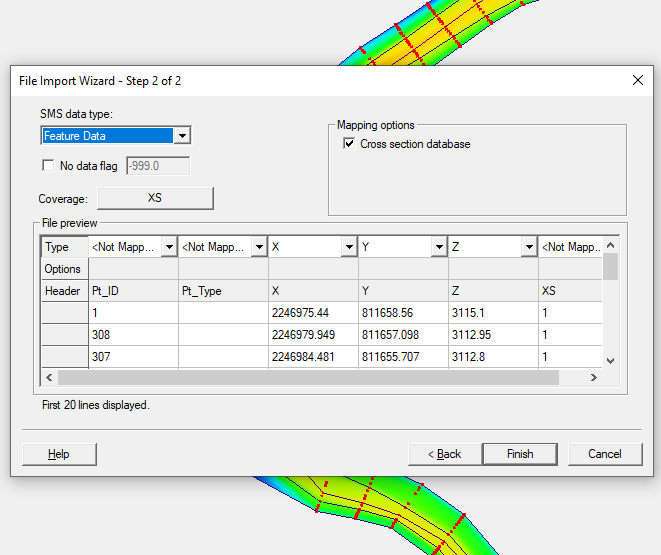
- In the first step of the File Import Wizard, set the fixed width or delimited properties as appropriate for the file.
- In the second step of the File Import Wizard, set the data type to be "Feature Data" and turn on the "Cross section database" option.
- Also in the second step, assign the columns of the text file to make the station ID, and xyz coordinates. There is also an option for a PT type that allows you to annotate features such as thalweg, left bank, right bank, left toe, right toe, abutment, pier, and so on.
- When done with the File Import Wizard, clicking Finish will import the database in your SMS project. It can be reviewed by looking at the arc attributes of the cross section arcs.
Once you’ve imported the cross section database, the cross section data is stored in the project file. Try out importing a cross section database into your SMS 13.1 projects today?