Using the Copy to Coverage Command
By aquaveo on November 11, 2020In SMS, after spending time creating the perfect arc, polygon, or series of points on a map coverage, you may find that you need that feature object added to other coverages. Recreating the same feature object manually could be too time consuming. Fortunately, with the release of SMS 13.1 beta, there is now the Copy to Coverage command.
The Copy to Coverage command allows copying selected feature objects from one map coverage to another. To use the Copy to Coverage command:
- Create the coverage that will receive the copied feature object.
- Select the desired feature object or objects in a map coverage.
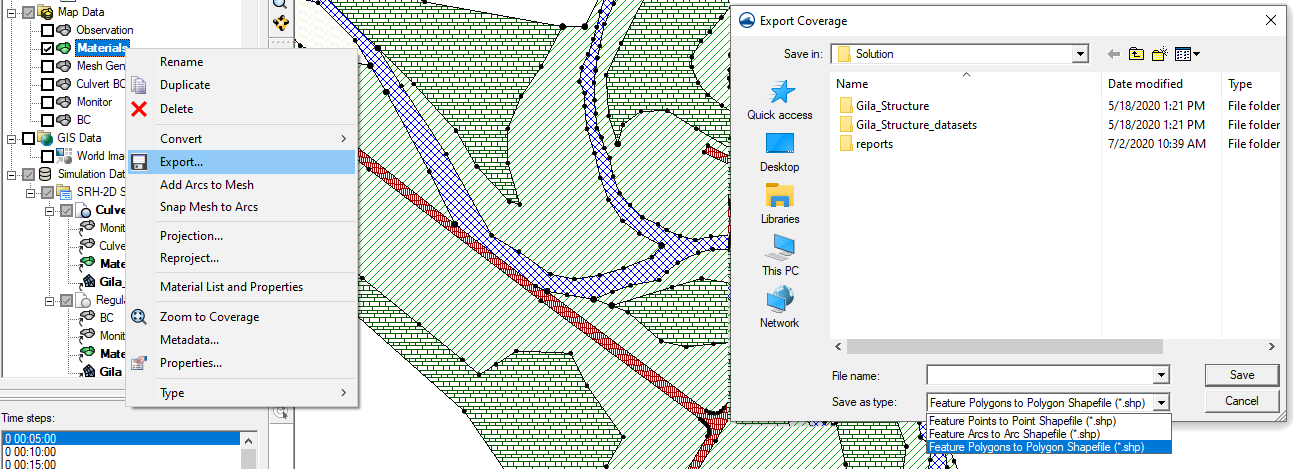
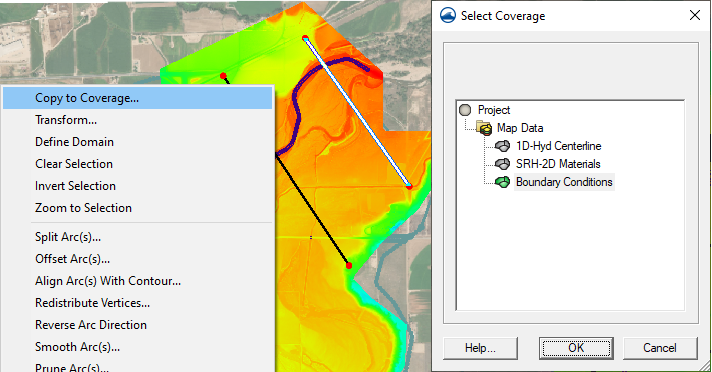
- Right-click and select the Copy to Coverage command.
- In the Select Coverage dialog, select the coverage that the feature object will be copied to.
When the feature object has been copied, attributes (boundary condition types, materials values, etc.) assigned to the object on the original coverage will need to be reassigned if the new coverage is of the same coverage type. Currently, feature object attributes cannot be preserved when copying to a coverage of the same type.
The Copy to Coverage command is most useful when you have a coverage with a lot of feature objects, such as those imported from a shapefile, but you are only needing one or two of those feature objects copied to a new coverage. For example, have a mesh generator coverage with arcs that would work well for boundary conditions, you could select and copy just the arcs that you intend you use as boundary condition arcs to a boundary conditions coverage. This is a faster process than duplicating the entire coverage, changing the coverage type, and deleting unnecessary objects.
You can copy multiple objects at once, by using the shift key to select multiple objects of the same type. In SMS 13.1, you can also use the universal Select Objects tool to select multiple feature objects of different types which can also then be copied to a new coverage.
Try out the Copy to Coverage command in SMS 13.1 beta today!