Aquaveo & Water Resources Engineering News

Tracing Municipal Water System Flow

Contaminants getting your municipal water system down? Using CityWater to create an animation tracing the flow of water through the system could help resolve this.

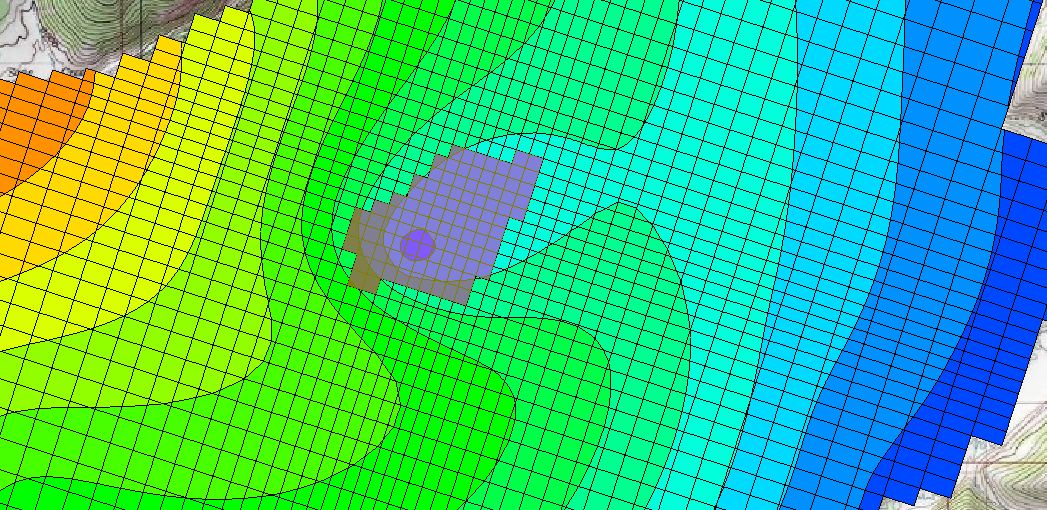
Tracing the flow of water through a municipal pipe system can help with figuring out how quickly a contaminant can propagate through the system, and also figuring out the general flow pattern of water throughout the system.

Some of the biggest concerns on city water manager minds in the last few years are preventing contamination in water systems and figuring out how quickly a contaminant spreads if water system integrity is compromised. Mention contaminated water, and examples such as the problems in Flint, Michigan come immediately to mind.

Contaminants can enter the system many different ways, including through broken pipes or leaching off the pipes themselves. If the pressure within a water system fluctuates too much, even a small break in a pipe can pull in any contaminants in the area. Using a trace animation in CityWater can provide a baseline for how far the contaminant may have gone.

It can also be important to know the flow from a particular location to anywhere else within the water system. This can be used to determine how quickly a flush of the system occurs, for example, and it provides a visual way to show the flow instead of looking at charts of numbers. It could also be used to determine what parts of the water system will be impacted by the introduction of a new pump or tank.

A trace animation can be generated in CityWater by doing the following:

  1. Open the map for the project.
  2. Select “Quality” for both Node and Link Layers.
  3. Click on the Animate Layers icon at the bottom right (below the legend).

This requires that the Quality Method parameter is set to TRACE and the Quality Trace Node is defined in Global Options. To do this:

  1. Go to your Project Details page.
  2. Select the Model Options tab.
  3. Edit the Global Options to turn on the TRACE option and define the Quality Trace Node.

Try creating trace flow animations in CityWater today by going to the Aquaveo Portal. Use “trycitywater” as the username and password.

Blog tags: 

Using Zonal Classification in SMS

Needing to identify part of your model that is prone to flooding? Or do areas of your project need to be marked off as a fish habitat?

While there are many tools in SMS that can be used to designate areas of a project as something different, one of the easier ways is to use Zonal Classification tool.

  1. Begin with opening your project containing scalar data. The scalar data can be loaded into the Scatter module, or be part of a 2D mesh or 2D grid.

  2. Next, open the Zonal Classification tool. Do this by selecting the Zonal Classification menu command in the Data menu in either the Scatter, Mesh, or Grid module.


  3. Once the Zonal Classification dialog is open, start setting criteria to define your zones. In the section titled “Zones”, click the New button to create your zone. You can define multiple zones at once while in the dialog.

  4. Once you’ve created your zones, you can define the criteria for each zone. Select the zone and click the New button in the Criteria List section. The criteria can be one of two types: a function criteria or a material criteria.

    As you’ve probably guessed, function criteria use a formula you specify to create the zone. Say you want to identify areas on your mesh below an elevation of 50 feet because those are areas you need to mark off as being prone to flooding. You’ll select the Function criteria option, select your elevation dataset, check the Less than option and enter a Value of 50.

    Similarly, you can choose to create zones based on materials. The materials need to have already been defined in the project before this option can be used. Once the materials are defined, you can create zones that either include or exclude areas of your projects where the zones overlap your scalar data.

  5. Finally, once, you’ve defined your criteria, you can have SMS create a new map coverage with polygons around the defined zone areas.

Try using zonal classification in SMS today!

Blog tags: 

Adding Notes in GMS

It happens from time to time—part of your groundwater model has something special that needs mentioning before handing it over to someone else. You may want to differentiate between two similar coverages without giving them long names, you may need to describe the real world source of a scatter set, or you need to explain how a quadtree was generated.

GMS provides an effective way to add notes to objects and datasets in order to aid in model development. There are two ways to add notes to objects in GMS.

The first is to add notes to object properties by doing the following:

  1. Right-click on an object in the Project Explorer and select the Properties command.
  2. In the Properties dialog, click on the Notes to tab to see all notes associated with the object.
  3. Click on the Add Row button to create a row where you can add your notes. The date and time you enter the note will automatically be added.

GMS can also automatically create notes when UGrids, datasets, and coverages are created. Using this feature requires that the Create GMS Notes Automatically option be turned on in the Preferences dialog.

As your project grows, you may find some notes are no longer needed. You can delete notes by going into the Properties dialog and deleting notes individual. If you have several notes that need to be removed, deleting them individually could be a hassle. GMS makes it easier by placing all notes contained in a project into one location.

  1. Select the Notes command in the Edit menu to bring up a dialog with all notes made in the project.
  2. From this dialog, you can select and delete multiple unwanted notes.

Now that you’ve seen how to create notes, try adding notes to your projects in GMS 10.3.

Blog tags: 

Exporting a Delimited Text File

Sometimes, the best way to share your solution data is through a text file. Data in text files can be formatted in a variety of ways, but delimited text files are supported by the widest range of applications out there.

Creating a delimited text file out of your SMS project is a little different than simply exporting the project as a text file.

  1. Select the Save As command in the File menu.
  2. In the Save As dialog, change the File type to be Tabular Data File (*.txt). This tells SMS you want to create a delimited text file.
  3. Enter a name for your file and make certain it is being saved to the correct directory.

After clicking Save in the Save As dialog, the Export Tabular File dialog should appear. In this dialog, you can specify how you want SMS to organize your file. You can select how many columns you want to have in your file and how those columns are going to be separated using a space, tab, or comma.

Importantly, you will need to select which data you want to have exported. You can select which mesh, grid, or scatter set you’d like to use, then define what will go in each column of the file.

The names of the column heads can be specified. If this option is used, the name of each column must entered in the column spreadsheet at the bottom of the dialog.

Clicking on the Data buttons in the column spreadsheet at the bottom of the dialog will bring up a dialog that lets you pick which datasets to include in each column. Normally, this will be your x, y, and z values. However, if you have more columns you can include other datasets. Both steady state and transient data can be exported.

You can also choose to have metadata saved with your file. This could include data such as the project projection or a polygon around the data boundaries.

Once done with organizing your file, click OK in the Export Tabular File dialog to save out your file. You can now send the text file to colleagues or use it in other projects with any software that can support a text file.

Try creating a delimited text file in the SMS today.

Blog tags: 

GMS MODFLOW and ArcHydro Training in Yerevan, Armenia

In January, Aquaveo sent Alan Lemon to Yerevan, Armenia to conduct a training course on using MODFLOW in GMS, and using ArcHydro Groundwater. The training covered the basics of using both GMS and ArcHydro Groundwater, as well as some specifics on how these tools could be applied in Armenia to help increase the efficiency of groundwater resource management. These trainings are very hands-on, which helps the participants more quickly learn how to use the tools.

Topics demonstrated and discussed included learning how to build customized AHGW geodatabases, and how to import, manage, and visualize various types of data for structures such as boreholes. The training also covered importing, editing, and visualizing 2D and 3D hydrogeologic models complete with cross sections and maps showing water levels and quality.

Members of the course included representatives from the Water Resources Management Agency and the Environmental Monitoring and Information Center of the Ministry of Nature Protection (MNP), Institute of Geological Sciences of the National Academy of Sciences of Armenia, the International Agribusiness Teaching Center at Armenian National Agrarian University, the American University of Armenia, and Yerevan State University.

This training was arranged by ME&A (Mendez England & Associates) as part of their ASPIRED (Advanced Science & Partnerships for Integrated Resource Development) program. We appreciate their help in arranging the training, and we appreciate the time and effort of all of the ministry and university participants. Despite having to work through a translator, all of the participants were focused and engaged, and a good rapport was developed.

We had a very enjoyable time there. To schedule your own onsite training course, visit the Aquaveo site today.

Blog tags: 

3 Great Features in SMS 12.3 Beta

Every new version of software comes with many new features and updates. The release of SMS 12.3 Beta is no different, with scores of updates and tweaks to make the user experience better. Most of these changes are behind the scenes, but we’d like to highlight three features which will prove very useful to our users.

1. Generating an observation arc plot

Right-clicking on an arc in an observation coverage now has the option to directly generate an observation profile plot from the selected arc. This allows you to see the elevations for the stream at that location. It is also faster than using the Plot Wizard. Simply use the Select Feature Arc tool to right-click on the specific arc and select Show Observation Plot.

2. Transparency options for filled polygons in the Map module

A transparency can now be set for filled polygons in the Map module. This means that materials coverages and other filled polygons can be better aligned with other coverages and GIS data such as background maps. Open the Display Options dialog, select "Map" from the list on the left, and turn on Fill in the Polygon section to access the Transparency slider.

3. Setting the Default Contour Range options

Some models include spin up or ramp times during which the numerical results are not within a typical range. This option provides a method for instructing SMS to skip these atypical or unreasonable values from impacting the default ranges of the contours computed.

Select Edit | Preferences… to bring up the Preferences dialog, then click Default Range Options in the Transient Contours section of the General tab to bring up the Default Transient Contour Range dialog. The dialog allows the first n time steps or hours to be skipped when creating the contour range, or to use the current time step.

Try out these features today by downloading the SMS 12.3 Beta.

Blog tags: 

Take Advantage of the Cloud for Engineering

These days, everything seems to be in “the cloud”, and for good reason. No more having to email or manually deliver a flash drive or DVD containing the documents or data. Having it stored in one online location accessible to everyone on the project makes everything more convenient, and makes it far easier to collaborate with others in your organization.

As an example a cloud-based application, you can use CityWater on the Aquaveo Portal, to access municipal water distribution data from anywhere using a modern web browser. One person uploads an input file for the model which can then be accessed by anyone in the organization.

Once the model has be uploaded, you and your colleagues can create multiple scenarios to generate alternate models. This allows quick collaboration for group planning of municipal water distribution projects. Feedback and comments can be made from multiple contributors to help everyone have their say. CityWater does all this while maintaining the integrity and security of the original model.

Your whole process becomes much simpler because the CityWater controls are designed from the ground up to scale from desktop to tablet to smart phone, all without removing any of the functionality. So, whether you’re in your office or out on a work site, the relevant data can be easily accessed with just a few taps. New and updated information can also be entered on the fly to make the model results more specific and accurate.

Because it doesn’t have to be purchased and installed on every computer or device, CityWater is much more cost effective. This allows the cost per user to be significantly lower, and your IT department won’t be burdened with additional work. The software behind CityWater is regularly updated, so anytime you log in through the Aquaveo Portal, you are using the most current version.

Try out the CityWater tool today by going to the Aquaveo Portal. Use “trycitywater” as the username and password.

Blog tags: 

6 Ways to Select 3D Cells

When using a 3D grid in GMS, it’s likely you will need to select a grid cell at some point in the project. This is usually a straightforward procedure. However, sometimes the 3D nature of the grid makes it less obvious as to which cells are selected.

To cover the basics of selecting cells, here are six ways to select 3D grid cells in GMS.

1. Select Cells Tool

The Select Cells tool is the most obvious choice and the tool most often used to select cells in a 3D grid. The tool can be used to select multiple cells by clicking and dragging a box over a group of cells. Multiple cells can be selected by using using the Shift or Ctrl keys. Select one cell, hold down the Shift key, and select a second cell to select both cells and all the cells in between. If you want to select cells without getting all the cells in between, use the Ctrl key.

Using the Select Cells tool only selects the visible cells, so be certain you are on the correct layer of your 3D grid. It will not select the cells underneath.

2. Select i, Select j, and Select k Tools

These tools are a lot like the Select Cells tool and operate in a similar way. The only difference is these tools will select entire rows or even entire layers. These tools depend on the view you are in and the layer being shown.

For example, if using the Select i tool, one or more rows can be select when in plan view. Only rows on the visible layer will be selected. When switching to a front view, the Select i tool will select all visible cells because all of the cells are active in the i direction of the 3D grid.

Unlike the Select Cells tool, the Shift key functions like the Ctrl key when selecting multiple rows of cells.

3. Select All

This tool does what it says. The Select All command under the Edit menu, will select all visible cells in the 3D grid. If the view is changed (e.g., from front view to plan view), all cells will be deselected. This command can also be accessed by pressing Ctrl+A on your keyboard.

4. Select With Poly

Dragging a box over a group of cells is nice, but sometimes you need a little more precision. Using the Select With Poly command in the Edit menu will let you click out a polygon shape to define your selection area. Double-clicking ends the process and reverts back to whatever tool you had previously selected.

5. Select By ID

Do you have a specific cell you want to select, for example the location of a well or perhaps you received an error message about a cell when running a model check? If you know the cell ID or the location, you can use the Select By ID command under the Edit menu. This brings up the Find Grid Cell dialog where you can enter the cell ID or location. When done, you’ll find the cell has been selected. This tool does require that the cell be visible in the Graphics Window.

6. Select By Dataset Value

Sometimes there is a range of cells you’d like to select which contain a specific set of values. This can be done by using the Select By Dataset Value command in the Edit menu. Be certain the dataset with the values you want to select is active before using this command. It will bring up the Select by Dataset Value dialog where you can specify selecting cells with a certain value range.

There are other ways to select cells in GMS, but these are the most common methods. Check out the selection options for 3D grids in GMS today!

Blog tags: 

How to Use TauDEM in WMS to Define Flow Paths

Using a watershed delineation tool is one of the first steps in creating a usable model for any sort of watershed, whether for conservation of natural resources, further development of a municipal drainage system, or determining potential flood zones. Tools such as TauDEM can make the process much simpler by basing those calculations off an existing DEM.

The process is generally straightforward:

  1. Import a DEM for the area in question.

    DEMs can be obtained many different ways. They can be imported directly using the features in WMS, they can be downloaded for free from the USGS and other governmental sites, or they can be created by you using lidar or similar tools. This is the DEM used in this example:

  2. Once the DEM is imported, activate the Drainage module.
  3. Select DEM | Compute Flow Direction/Accumulation... to bring up the Flow Direction/Accumulation Run Options dialog.
  4. Select Run TauDEM under Select the model to determine the flow direction/accumulation.
  5. If you want to use multiple processors, check the box next to Use MPICH2 and enter the number of processors.

    If you don’t know if your computer has multiple processors, simply leave the box unchecked.

  6. If this is your first time running MPICH2, click Register MPIEXEC and enter your username and password at the prompt. This should be your Windows username and password.
  7. Click OK to close the Flow Direction/Accumulation Run Options dialog and bring up the Units dialog.
  8. Set the units to be appropriate for the location of the project and click OK.

    The watershed delineation process can take some time, depending on the size of the area being delineated and the computer being used. Once TauDEM has finished delineation, the cells accumulating the flow will appear.

  9. When TauDEM is finished running, click Close to exit the Model Wrapper dialog.

TauDEM is part of the Community Edition of WMS, so you can try out this feature today.

Blog tags: 

How to Make an Unstructured Floodplain Mesh

Flooding can cause significant--and sometimes devastating--damage to infrastructure, crops, and commercial, residential, and industrial buildings. Unstructured floodplain meshes can be used to anticipate the most likely scenarios and plan prevention and mitigation accordingly. These are only some of the reasons why an unstructured floodplain mesh might need to be created. Your project may include multiple low lying areas that historically flood. You may need to see where berms or channels need to be adjusted to better accommodate sudden flow increases and prevent or mitigate flooding.

There are a few steps that should be taken anytime you model and simulate an unstructured floodplain mesh. SMS simplifies this process.

1. Import Background Data

The first step is usually to import elevation data from a scatterpoint dataset, raster objects, lidar data, mesh, grid, or from an existing project that includes the required elevation information for the floodplain. If the elevation data is not from a scatter set, it will need to be converted to a scatter set or interpolated to the mesh after the mesh is generated.

An aerial photo of the area can also be imported to help with visually referencing rivers, roads, and other structures.

2. Create a Mesh Generator Coverage

Once the elevation data has been imported, create a mesh generator coverage by right-clicking in the Project Explorer and selecting the New Coverage command. From the New Coverage dialog, select the Mesh Coverage type and enter a name for the coverage.

3. Create Feature Objects

The unstructured floodplain mesh will be generated from polygons in the mesh generator coverage. On the mesh generator coverage, create the enclosed arcs encompassing the area of the floodplain using the Create Feature Arc tool. Turn the enclosed arcs into a polygons by using the Build Polygons command.

4. Assign Mesh Type and Bathymetry

Use the Select Feature Polygon tool to double-click on each of your polygons. In the dialog that appears, assign the mesh type you want to create. You can use the Preview Mesh button to ensure your mesh will generate correctly.

After selecting the mesh type, select constant value or scatter set to use as the mesh elevation.

Once this is done for all your polygons, you are ready to generate your unstructured floodplain mesh.

5. Generate the Unstructured Floodplain Mesh

The process of generating your mesh is quite simple if the above processes are followed. Simply right-click on the mesh generator coverage and select the Convert to 2D Mesh command. SMS will start the calculations to create the mesh. Older versions of the software will bring up an options dialog where a few changes can be made to how the mesh is generated. For most projects, the default options are acceptable. A dialog will then appear asking you to name your mesh—the final step in creating the mesh.

Now you have an unstructured floodplain mesh. Explore the mesh to see if you like the results and get started on the rest of your project. You can adjust the display options at this point to make sure your mesh is satisfactory.

You can try out creating unstructured floodplain mesh generation in the SMS Community Edition for free.

Blog tags: 

Pages