Aquaveo & Water Resources Engineering News

Draping an Image onto a Ground Surface

When looking at your GMS project in oblique view or when using the Rotate tool, you might have noticed that your map image will disappear. This is because GMS only supports viewing map images in plan view. However, there is a way to make the map image visible in these views.

The ability to drape an image in GMS has been around since the early versions. However, you may not have had an opportunity to use it, or you simply missed hearing about it among all the other great things GMS does.

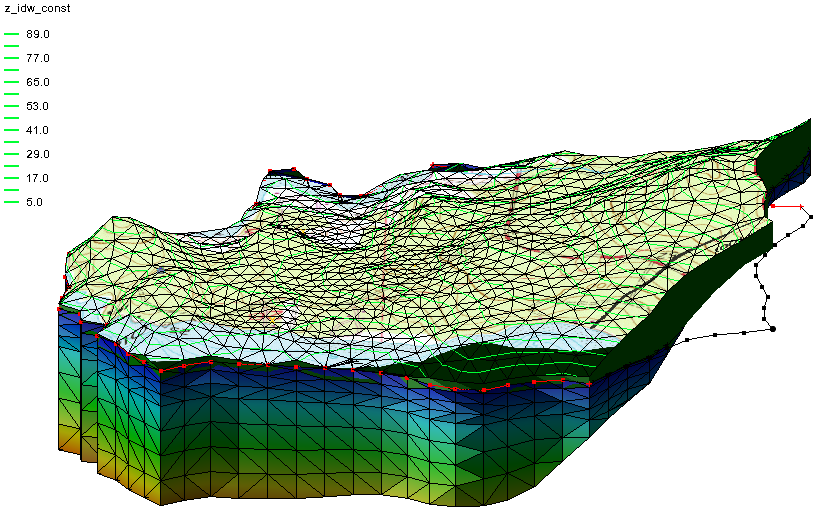
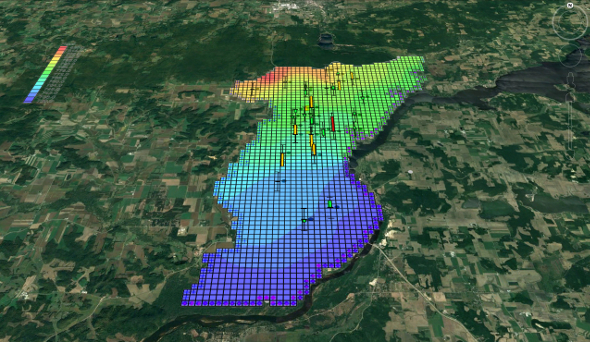
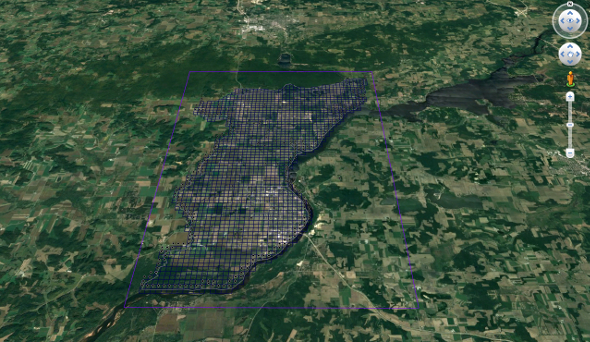
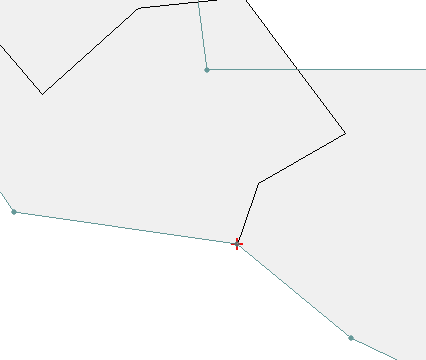
When not in plan view, an image can be draped on the top surface of a TIN, mesh, or grid. When this is done, the map image will remain visible even when rotating the display view. Some relationships between the surface texture and the shape of the terrain can become visible after the image has been draped over the terrain surface.

If you didn’t already know how to drape an image in GMS, or you want a refresher on how to do it, this is what you do:

  1. Turn off Ortho Mode if it is active. Draping an image cannot be done using Ortho Mode.
  2. Select and make active the map image you want to view. You can use any image file type that GMS can import.
  3. Select a dataset under your grid, mesh, or TIN in the Project Explorer and make it active. A draped image is only applied to one dataset at a time.
  4. Open the Display Options dialog.
  5. Select the appropriate grid, mesh, or TIN display tab.
  6. Turn on the Texture map image option.
  7. Use the Rotate tool or any of the view options to see how the image mapped to the top surface of the geometry.

Here’s an example of how it will appear:

If desired, you can adjust the Lighting Options in GMS to make the features smoother or sharper.

Now that we’ve reviewed the steps, try draping images in GMS today using the GMS Community Edition.

Blog tags: 

Computing Basin Curve Numbers in 9 Easy Steps

Need to predict direct runoff or infiltration from rainfall excess? Computing a curve number (CN) is a common solution to this problem. The curve number method was developed by the USDA Natural Resources Conservation Service using empirical analysis of runoff from small catchments and hillslope plots.

To calculate a CN you will need the hydrologic soil groups, land use data, and rainfall conditions for a given area. You then need to enter the values for the CN equation to get your final values. While you could calculate a CN manually, WMS can do the work for you.

  1. Import data for the area, either as map coverages or as GIS data. It is import that you review this data for accuracy before using it to compute a curve number. Required data includes land use data and soil type data.
  2. Create a land use ID table file. This can be done in any text editor and should be saved as a standard text file. Examples can be found in the XMSWiki and in the TR-55 manual.
  3. Make the Hydrologic Modeling module the active module.
  4. Select the Compute GIS Attributes command in the Calculators menu.
  5. In the Compute GIS Attributes dialog, select the SCS Curve Number option.
  6. Select the coverage or GIS layers to use for the calculation.
  7. Import the land use table file by clicking the Import button and selecting the land use table text file.
  8. Once your options are set, click OK to generate your curve numbers.
  9. If needed, in the View Data File dialog, select the text editor to use to see your final curve number results. This dialog may not appear if a default text editor has been selected.

Now you can review the curve numbers in your text file. Try calculating Curve Numbers in WMS Community Edition today!

Blog tags: 

Converting a NET File to an INP File

Do you have an EPANET project you are wanting to import into CityWater?

When working on a municipal drinking water pipe network, EPANET is a water distribution model created by the U.S. Environmental Protection Agency that is widely used by cities and towns all across the United States. However, not all programs can use the native EPANET project file format. Because of this, you may find yourself needing to convert the standard NET file used for EPANET projects into an INP file that can be imported into CityWater.

The NET file is a binary file format containing all the pipe networks information, including pipes, nodes (junctions), pumps, valves, storage tanks, and reservoirs. It also contains additional project and preference information used by the EPANET desktop application.

INP files are the plain text version of the NET file, and contain the same network information (EPANET 2 Users Manual, pp.128-129). The INP file format allows greater flexibility in how the pipe network is used, and it can easily be imported into CityWater and other programs such as WMS.

The first steps are to:

  1. Download the EPANET installation program (currently version 2.00.12) from the Environmental Protection Agency's EPANET website.
  2. Once the installer has downloaded, run the installation program.

Once the EPANET application is installed, use the following steps to convert your NET project file to the INP text format by doing the following:

  1. Launch the EPANET application.
  2. Open the NET project file in EPANET.
  3. Review the model to make certain the project is set up as you want it, including quality options and default settings.
  4. Select Export > Network... to bring up the Save Network As dialog.
  5. Browse to the directory where you wish to save the INP file.
  6. Enter the file name you wish to use (e.g., Filename.inp) and click Save.

The INP file can now be imported easily into CityWater as the base file for a new project.

Try this out today by converting your NET files and creating new projects in your CityWater project.

Blog tags: 

Troubleshooting Errors in SRH-2D

It happens. You‘ve finished building your SRH-2D model in SMS and you launch the model run. Then, to your dismay, SRH-2D stops running and gives you an error.

It’s not fair. You did everything correct and entered all the correct parameters. SRH-2D should be running and giving you its valuable results. But instead you have an error message.

Don’t panic.

While it is discouraging for SRH-2D to not complete when you launch the model run, it is only telling you that a key bit of data is missing for it to give you valid results. The error code will help you locate that data or fix an inconsistency.

But how do you use the error code to find what needs to be fixed? And shouldn’t the SMS model checker have found it before SRH-2D started?

The SMS model checker verifies all the data needed to run SRH-2D is present and looks for errors in the SMS project such as dangling arcs, numbering issues, or missing components. It does not validate the data. Once the SMS model checker has finished, SRH-2D performs its own checks during the model run.

When SRH-2D gives you an error, you’ll need to record the error number. Errors are shown in the model wrapper. Clicking on the Pre-SRH-2D button will show if there are errors during the pre-processor run. Clicking the SRH-2D button will show errors during the model run.

Once you know what the error is, you can look up the list of SRH-2D errors on the XMSwiki here. The article contains a list of known errors along with guidance on how to fix them.

If you were unable to record the error from the model wrapper, don’t worry. You can still see this information by reviewing two of the files generated by SRH-2D during every model run. These files will be named [projectname].OUT.dat and [projectname].DIA.dat files.

To use these files:

  1. Locate the files in the model run directory with your project file.
  2. Open the *.OUT.dat or *.DIA.dat files using a text editor such as Notepad.
  3. Look through the text file to locate the error code.
  4. Go to the SRH-2D error page to find the solution.
  5. Make the needed change(s) to your project and run SRH-2D again.

Typical solutions to SRH-2D model run errors might involve adjusting some data inputs or making minor reconfigurations to boundary conditions or structures. While making these changes to a project can sometimes be frustrating and tedious, getting an accurate end result will make it all worthwhile.

This is a great troubleshooting process you can use to create many successful SRH-2D model runs. If you haven’t already made use of SRH-2D, feel free to explore it in the Community Edition of SMS.

Blog tags: 

Community Pinewood Derby

Recently, Aquaveo’s Provo office participated in a Pinewood Derby race with several other local companies. For those unfamiliar with the sport, it involves racing small wooden kit cars down a track. The tradition in Cub Scouting was begun nearly 65 years ago in Manhattan Beach, California.

As anyone familiar with the pinewood derby can attest, it requires some engineering know-how to create a speedy car from a block of wood. Getting the proper shape for the car, placing the correct amount of weight in the right location on the bottom of the car, and establishing the correct wheel balance and alignment are all important factors to consider. All of this is done to make the cars go as fast as possible without them wobbling off the side of the track or skidding along the edge of the track.

The other companies participating included HadCAD, Charity Vision, Jones T-Shirts, Link Trust, Alpha Solar, and Sawtooth Software.

Around a dozen cars were entered, and each ran four races--one on each track. The slowest time was discarded and the car with the fastest average time won. Two of the cars employed 3D printing: a red one with a full 3D printed shell that fit snugly over the top of the base wooden block, and a Batmobile with a 3D printed airfoil and Batman figure. One of the most creative was a car designed to look like a pinewood derby car on a track.

We had two entries from Aquaveo employees: a silver and black car designed by Gage Larsen (Testing Manager), and a red and blue car designed by Steven Estep (Technical Support). Steven’s car finished in 6th place overall.

We look forward to another race next year.

Exporting Raster and Vector KMZ Files

Need to open your project data in Google Earth? GMS can do that by generating a KMZ file from your project data.

GMS allows creating either a raster KMZ file or a vector KMZ file.

Raster KMZ File

This option saves the project data as an image with georeferencing data. The data is clipped to match the current view in the Graphics Window.

To create the file:

  1. Switch to Plan View.
  2. Check that you are using geographic coordinates, otherwise it may be distorted.
  3. Use the File | Save As command.
  4. Set File of Type to be "Google Earth Raster KMZ File (*.kmz)".
  5. Select the Options button to set the resolution.

When pulled into Google Earth, a raster KMZ will simply display the file data as an image over the georeferenced location.

Vector KMZ File

This option saves the project data as vector information. All visible data in the Graphics Window will be included. Points, lines, and polygons will be saved in the file along with the georeferenced data.

  1. Switch to Plan View.
  2. Use the File | Save As command.
  3. Set File of Type to be "Google Earth Vector KMZ File (*.kmz)".

When imported into Google Earth, a vector KMZ will contain an image over the georeferenced location, along with a layers for any lines, points, or polygons contained in the file. These layers can be toggled on or off.

Transient Data

Transient data in GMS can be exported as a raster KMZ file animation.

  1. Switch to Plan View.
  2. Check that the project is using global coordinates.
  3. Select the Display | Animate command.
  4. In the Animation Wizard, turn on the KMZ file option.
  5. Set the options for where to save the file and what parameters to use.

After GMS generates the animation, you can open in Google Earth to see the results.

Now that you’ve seen how KMZ files can be generated, go ahead and give it try in GMS today.

Blog tags: 

2 Ways to Import ArcGIS Files into WMS

ArcGIS software has long been a standard in generating geographic data. It is likely you will have received a shapefile generated in ArcMap at some point. ArcGIS files can be imported into WMS to save you time in recreating geographic data.

There are two main methods for importing ArcGIS data: through the standard open dialog or through the GIS module.

Standard Method

To import ArcGIS files into WMS:

  1. Select the Open command in the File menu.
  2. Make certain the Files of Type field is set to "All Files" or "Shapefiles".
  3. Browse to your file and open it.

That’s all you need to do. You can also use any other standard methods for opening files such as using the Open macro or dragging the file onto the Graphics Window. There is also a command to open shapefiles in the Data menu in the GIS module.

Right-clicking on the the imported shapefile in the GIS module allows joining table and layer data. This data can then be mapped onto a coverage using the Shapes → Feature Objects command in the Mapping menu.

A grid coming from ArcGIS will be imported as a DEM in the Terrain Data module . A TIN will also be imported into the Terrain Data module.

GIS Module

When the GIS Module is active, you can use commands to directly import ArcGIS data into WMS. To do this:

  1. Make certain the GIS module is active.
  2. Select the Data | Add Shapefile Data command.

  3. or

  4. Select the Data | Add GIS Data command.
  5. Use the file browser to locate your files and import them.

This second method is useful for a wider range of ArcGIS data files. If a file does not open correctly using the standard methods, then importing the file through the GIS module is recommended.

DEMs and TIN files opened through the GIS module will be imported into the GIS module instead of the Terrain module.

Take a look at what other GIS tools are offered in WMS.

Blog tags: 

Using Snapping in SMS

In many projects, you might find a need for nodes or vertices to line up exactly. You can achieve this by using the Snapping feature in SMS. Snapping nodes to arcs can be accomplished two ways in SMS: by cleaning and by using the snapping crosshairs. In some cases, two arcs might need to be very close to each other but not snapped to the same nodes or vertices on a mesh. This post will discuss how all of this works.

Clean Option

The Clean option allows any two nodes on the same coverage to be "snapped" together To snap two nodes on the same coverage:

  1. Select the desired nodes.
  2. Select the Clean... command from the Feature Objects menu.
  3. In the Clean Options dialog, turn on Snap selected nodes.
  4. Select the desired node as the snapping point.

The nodes will be merged into one node at the desired location.

Nodes and vertices can also be snapped using a tolerance value. This will snap all nodes in the coverage to be within the tolerance.

  1. Select the Clean... command from the Feature Objects menu.
  2. In the Clean Options dialog, turn on Snap nodes and vertices.
  3. Set the Tolerance level.

The tolerance units are the same as those set in the projection. This method may cause vertices to be redistributed along some arcs, so it should used carefully.

Snapping Feature

If Snapping is turned on the Map tab in the Preferences dialog (see image below), red crosshairs (see image below) will appear when creating an arc and the mouse moves near an existing node or vertex. This indicates that the node or vertex will snap to the existing node or vertex in the coverage. If two vertices snap, they turn into a single node. Snapping can be turned on and off when in the Map module by pressing "S" on the keyboard.

Snapping Across Multiple Coverages

To snap across multiple coverages, Inactive coverages must be turned on in the Display Options dialog. This prevents nodes or vertices from appearing to be snapped when they are not (see the images below). The first shows what appears to be two vertices that are snapped. The second shows a zoomed view showing they are not actually snapped.

Snapping can also occur between a coverage and a geometry such as a mesh or a grid.

Nodes That Should Not Be Snapped

Keep in mind that if two boundary arcs are close to the same node(s) on the mesh or grid, a simulation may snap them to the same node(s) within the simulation, which may cause errors. This can be fixed by either refining the mesh or grid so there are more nodes to use, or by moving one or more of the arcs slightly.

Try using the snapping feature today in the Community Edition of SMS.

Blog tags: 

Creating a Transient Animation

After creating a transient dataset, it can be time consuming to click through each time step to evaluate the changes over time. One of the fastest ways to view changes in transient data is to create an animation.

Creating an animation in GMS can be done quickly using the Animation Wizard.

Once you have a transient dataset with multiple time steps in your project, do the following:

  1. Select the dataset you want to animate and make certain your project is displayed how you want to see it in the Graphics Window. The animation will be created from what is visible in the Graphics Window.
  2. Select the Animate command in the Display menu to open the Animation Wizard.
  3. In the first part of the Animation Wizard, select where you want to save your animation, what file type you wish to use and the animation quality.
  4. In the second part of the Animation Wizard, set your time duration and add a display clock. The options here will vary depending on what options were selected in the first part of the Animation Wizard.
  5. When you click Finish, GMS will create your animation.

If you selected the AVI file format, GMS will display it for you in the Play AVI Animation application (Pavia). This player is included with your installation of GMS. If you selected the KMZ format, GMS will display your animation in Google Earth (if it is installed).

Once you’ve created an animation, you can view it again when you reopen the project. To do this, select the Play Animation command in the Display menu. This will tell GMS to locate the animation file associated with the project and open it in the AVI player. This operation only works for AVI files.

Files can be exported in either AVI format or KMZ format. The AVI file can be used with most other video players, including Windows Media Player or QuickTime Player. KMZ files can be opened with Google Earth.

With the basics down, you can now try creating animations for your own projects in GMS.

Blog tags: 

3 Ways to Download Images in WMS

Many projects start with an image, because we like to see what we’ll be working on. It’s always possible to import an image file, but if you don’t already have an image file, then what? Well, when WMS is able to access the internet, it can download an image for you.

The advantages of online images are that they can be seamlessly integrated into projects, data is available for locations throughout the world, and they can be reprojected to the display projection without needing to georeference the image.

To download an image, WMS provides three tools: Get Online Maps, Get Data From Map, and the Get Data tool.

1. Use the Get Online Maps Tool

The Get Online Maps tool connects to a data server where real world images and data can be downloaded into your project. To use the Get Online Maps tool:

  1. Click on the Get Online Maps macro . This will bring up the Virtual Earth Map Locator dialog, if there is not a projection already set in the project.
  2. In the Virtual Earth Map Locator dialog, find the location where you want to retrieve data.
  3. Next, the Get Online Maps dialog appears where you select which type of data you want to retrieve, (i.e., a topographic map or elevation data).
  4. Download the image.

The downloaded image is a dynamic image. This means it will redownload data when you zoom in or out in WMS. The image has not been saved locally at this point. To save:

  1. Right-click and select Export.
  2. Use the Resample and Export Raster dialog.
  3. Enter the file name.

This saves a static image to your hard drive. It can then be used again in the future.

2. Use the Get Data From Map Tool

If you don’t want to get a dynamic image, you can skip directly to downloading a static image. To do this:

  1. Click on the Get Data From Map icon to bring up the Virtual Earth Map Locator.
  2. Select the desired location in the Virtual Earth Map Locator dialog. If you have a projection set or have previously downloaded an image, this dialog will be show that area.
  3. The Data Services Options dialog will appear next. Select the type of data you want to retrieve.
  4. WMS will then ask you to save the file as a static image before downloading the data into your project.

With the Get Data From Map tool, you have a static image ready for use in your project with the file available for other projects if needed.

3. Use the Get Data Tool

The Get Data tool allows you to retrieve an image for a specific location in your project. The project display projection must be set to an appropriate “Global projection” option for this to work.

  1. Select the Get Data icon and draw a box in the Graphics Window to select the desired area for the image.
  2. Select a data type in the Data Services Options dialog.
  3. You will then be asked to save the file as a static image.

Now you will have image data that only covers the area you drew out in the first step. This is helpful when you only need a specific piece of data, or data only for a specific location.

Try out these three ways to download image data in WMS today. We recommend experimenting a little so you can learn all the different ways these images can be used.

  • Note that in 2017, the server used by the WMS online map tools was discontinued by Microsoft. A new server has been selected and is used in the current version of WMS. Because of this, older versions of WMS may not be able to use the online map tools.
Blog tags: 

Pages