Tips for Using the Measure Tool in WMS
By aquaveo on October 6, 2021Have you used the Measure tool in WMS? You probably have, but would you like to know more about the tools capabilities? This post will review the capabilities of the Measure tool and give some tips for using it.
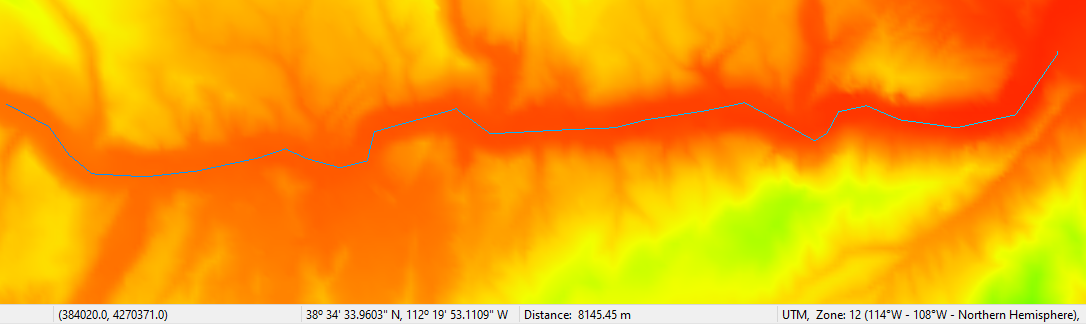
The Measure tool allows you to measure distance, slope, and in some cases angles along a path you define. It is designed to give you real-world measurement sizes, and can be useful when the scale of parts of a model aren't immediately apparent. When the tool is selected, you will be able to define a series of line segments along a path. This path can be continually defined until it is terminated by double-clicking. When the path is terminated, it will disappear from the Graphics Window, but along the bottom of WMS, in the Help Message window, the relevant values will be displayed in red text. These will be updated whenever the Measure tool is used, reflecting the most recent path that was defined.
The units for distance and slope will depend on the units set by the projection, or by the project defaults, either ft and ft/ft (feet) or m and m/m (meters). It is recommended to make certain you have set the correct units for your project before using the Measure tool.
Angle will only be reported when a line only has two points, whereas distance and slope are always reported. Angle will be measured in radians. Angle will be calculated by measuring an angle starting from a reference line pointing south from the first point, and ending at the line segment defined by the two points.
If you have a TIN or DEM loaded into the project, the Measure tool will be able to get slope values. When the Measure tool is used on an area without elevation data, the slope will be given a value of zero. Slope will be calculated by taking the distance-weighted average of the slopes of all the segments. For each segment, slope will be calculated by dividing the change in elevation across the points by the xy distance of the segment.
The Measure tool can help you build and design your project with accuracy. Try out the Measure tool in WMS 11.1 today!