WMS

ASCII Grid Files for GSSHA in WMS

The Watershed Modeling System (WMS) offers powerful tools for managing and analyzing spatial data using ASCII files. In this blog post, we will explore WMS ASCII files, discuss specific file formats like the *.dep (DEPTH) and *.gfl (FLOOD_GRID) outputs as well as the possibility of exporting ASCII gridded files for GSSHA.

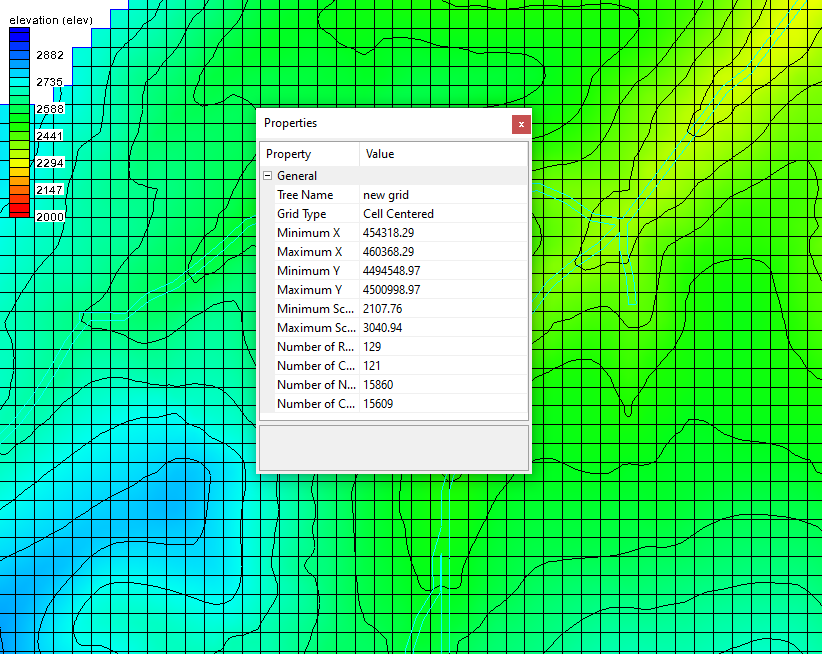
WMS utilizes ASCII files to store and exchange spatial data, such as boundaries, elevation data, and model outputs. To extract information from these files, it is helpful to understand their formatting. The WMS ASCII file contains coordinates representing the boundary limits of the data. However, a common question arises regarding whether these coordinates represent the corner or center of the boundary cells. The coordinates provided in a file header can represent the lower left corner of the cells rather than their center. This information is for accurately defining the spatial coverage of the data.

ASCII Gridded Files Format

WMS is capable of outputting files containing spatial information as grid files, such as the DEP and GFL files. These files store multidimensional data (time, x, y) in a single column format. In the DEP and GFL files, as well as other GSSHA files, the data is organized by cell ID. The introductory information in the file provides details such as the type of information, geometry type, number of cells and values, and dataset name. Each time step is indicated by the TS field, followed by the corresponding data. The dataset file concludes with a flag indicating the end of the data.

ASCII gridded file properties in WMS
Exporting ASCII Gridded Files with GSSHA

While discussing GSSHA, it is important to note that it employs cell-centered Cartesian grids. It is also important to note that GSSHA does not offer alternative export formats for gridded files, apart from the ASCII-based output options provided in WMS. These options can be found by doing the following:

  1. Select GSSHA | Job Control command to open the GSSHA Job Control Parameters dialog.
  2. Click the Output Control button to open the GSSHA to Output Options dialog.
  3. In this dialog, make certain that the ASCII option is selected for output.

ASCII gridded files are one of the many options you can use with GSSHA in WMS. Try out ASCII files and other formats in WMS today!

Blog tags: 

Combining Runoff in Watershed Basins with WMS

The Watershed Modelling System (WMS) includes use of the Rational Method, which enables the calculation of peak flows for small watersheds in urban and rural areas. This feature can combine runoff from multiple basins to find the values.

The Rational Method requires a couple specific components to calculate the runoff coefficient for an area. The required inputs are soil data, along with either a table relating soil IDs to runoff coefficients, or a runoff coefficient coverage. Composite runoff coefficients use an area-weighted average of all runoff coefficients that overlay each basin for computation. The inputs chosen will depend on what method you choose to calculate runoff in the Rational Method module. The two primary methods to calculate runoff are first, to assign coefficients to polygons within a coverage, and second, to import a table with all of the coefficients already assigned to a land or soil use ID.

Example of Land Use in WMS Example of Soil Group in WMS

There are two ways to assign runoff coefficients to a polygon. The first way is to enter the coefficients polygon by polygon, and the second is to assign the coefficients through the Soil type mapping dialog.

To assign runoff coefficients polygon by polygon, do the following:

  1. Start with a Runoff Coefficient coverage.
  2. Select one of the polygons that intersects the drainage basin.
  3. Enter the runoff coefficient that matches the soil or land type for that polygon in the Runoff Coefficient dialog window that appears.
  4. After entering the data for each polygon that intersects the basin, activate the Hydrologic Modeling Module and go to Calculators | Compute GIS Attributes.
  5. In the Compute GIS Attributes dialog, make sure the following options are active:
    • “WMS Coverages” is selected as the data type.
    • Under Computation, Runoff coefficients is selected on the dropdown menu.
    • The “Use” dropdown is set to runoff coefficient coverage.
    • The “coverage name” dropdown is set to your new coverage.

To assign runoff coefficients to polygons by soil mapping, do the following:

  1. Start with a “Soil Type” coverage.
  2. Select one of the polygons that intersects the drainage basin.
  3. On the bottom left of the Soil type mapping dialog that appears, turn off the "SCS Soil Type" checkbox and turn on the "Runoff Coefficient" checkbox.
  4. You will now have a list of soil IDs and names with a field for runoff coefficients. Enter a coefficient value for each of these fields according to the material type.
  5. Open the Compute GIS Attributes dialog as described above.
  6. Set everything the same as are in the last set of steps, except change the "Use" dropdown to Coverage.

There are multiple ways to create runoff coefficient tables to import into a project. One of the ways is to create a table from scratch. If you choose this route, you can view the structure requirements on the Aquaveo wiki to make sure it includes everything you need. To import a table with the runoff coefficients, do the following:

  1. With the “Soil Type” coverage active, double-click on a polygon that intersects the drainage basin.
  2. Select “Import file” under Import soil attribute file.

You can also import a table in the Compute GIS Attributes dialog.

Head over to WMS and try out the different ways to assign runoff coefficients to your watershed project today!

Blog tags: 

Filling Missing Raster Data

Do you have a raster that has holes in it? The Fill Nodata can fix small holes in raster data. Available in GMS, SMS, and WMS. In this article, we will explore the ways that the Fill Nodata tool can be used in WMS.

The Fill Nodata tool fills in small areas or gaps in a raster where no elevation data exists. It is located in the Rasters/Fill Nodata section of the Toolbox. The tool will interpolate an elevation to raster cells that are classified as "NODATA". Then the tool will create a new raster in the project that has the fillable no data areas filled.

Example of the File Nodata tool

These holes in the raster can occur for a number of reasons, one of the most common being that the data is incomplete. WMS is flexible enough that it can use a raster with small amounts of missing data for most simulations. However, it is recommended that you have data that is as complete as possible to ensure the generated model is as accurate. Therefore using the Fill Nodata tool can help ensure the accuracy of your model.

The Fill Nodata tool has a few input parameters to keep in mind. The input raster is the most important parameter. This needs to be a raster that has been imported into the project. The maximum distance to interpolate determines how far out WMS will look to fill data. It will use pixel units to do this. The number of 3x3 average filter smoothing iterations to run determines how many smoothing interactions will be run after the interpolation has been calculated. Additional interactions can help in improving the fill data.

Keep in mind that the tool was not intended to create data for large regions of missing data cells, especially regions on the border of the raster. If you have a large area of missing data, it would be best to use other processes to fill in the missing data, such as downloading the missing data and merging it with your raster.

The Fill Nodata tool is one of thetools provided in WMS to let you modify and edit raster data. Try out the Fill Nodata tool in WMS today!

Blog tags: 

Using CAD Data to Delineate a Watershed

Did you know that you can use CAD files to delineate your watershed area in a Watershed Modeling System (WMS) project? WMS is capable of using CAD data for elevation data, designs, layouts, and more. CAD data can be converted to TINs and feature objects to be implemented in a WMS project.

When converting the CAD data to feature objects, you can choose which layers from the data you would like to use when creating the new feature object. After that, you can clean up the feature object and choose all the properties for the coverage. To convert CAD data into feature objects, do the following:

  1. Import the CAD data into WMS from a DWG, DXF, or DGN file.
  2. After importing the CAD data, review the data to verify that it was imported correctly and that it has the correct projection.
  3. Right-click on the file in the Project Explorer and select Convert | Feature Objects….
  4. In the Cad → Feature Objects dialog, select which layers to convert into feature objects.
  5. Make certain the new coverage is set to have the "drainage" type.
  6. Designate the converted feature objects as outlet points and streams. Also verify that any stream arcs a set with the correct direction.

With the CAD data converted to feature objects and you've designated your outlets and streams, you can start the process of delineating your watershed. To do this, you will need a DEM in your project. If you have elevation data stored in a CAD file, you will first need to convert the CAD data to a TIN.

Basin delineated from CAD data

CAD data can be converted into TIN points or TIN triangles, but the best way to end up with TIN triangles is to convert into TIN points first. To convert CAD data directly into TINs, do the following:

  1. Import the CAD data into WMS in the form of a DWG, DXF, or DGN file.
  2. Right-click on the file in the Project Explorer and select Convert | CAD Points → TIN Points.
  3. In the Cad → TIN dialog, select which layers to convert and the name the TIN data will appear under in the Project Explorer.
  4. Right-click on the TIN point data in the Project Explorer and select Triangles | Triangulate.

From here you can convert the TIN to DEM if necessary. The TIN module in WMS has a few tools for working with basins that may be sufficient for your model. However, some models either perform better or require a DEM. Once you have the DEM you can generate the delineated basin. To do this:

  1. Right-click on the TIN and select Convert | TIN → DEM.
  2. Enter parameters for the DEM in the Convert TIN to DEM dialog.
  3. Review the generated DEM.

Once you have a DEM, complete the following steps:

  1. Select DEM | Compute Flow Direction in the Drainage module.
  2. Select DEM | Polygon Basin IDs →> DEM in the Drainage module.
  3. Select DEM | Compute Basin Data in the Drainage module.

Once you have a delineated basin, you can use the basin with the watershed modeling model of your choice. Be certain to review the basin to make certain it contains all of the area you need for your project.

Head over to WMS and see how you can utilize CAD data to create delineated basins in your projects today!

>
Blog tags: 

Pages