Exporting Map Coverages in SMS
By aquaveo on May 18, 2022Do you have a map coverage with specific defined attributes in an SMS project that you would like to add to another project? There is a solution: starting in SMS 13.2 you can export your map coverage as a DMC file that you can import into another project.
For exmaple, say that you have defined a weir structure on an SRH-2D boundary condition coverage for your project. You could, conceivably, have a massive project with many different coverages, meshes, and simulations. If you, or a coworker, would like to use that weir with its defined attributes in another project, recreating the same weir would be inefficient. Instead, exporting just the weir coverage as a DMC file allows you to import the weir coverage with its feature objects and attributes into another project. This will save time for everyone involved in the project, streamlining the process.
There are three steps to export a map DMC:
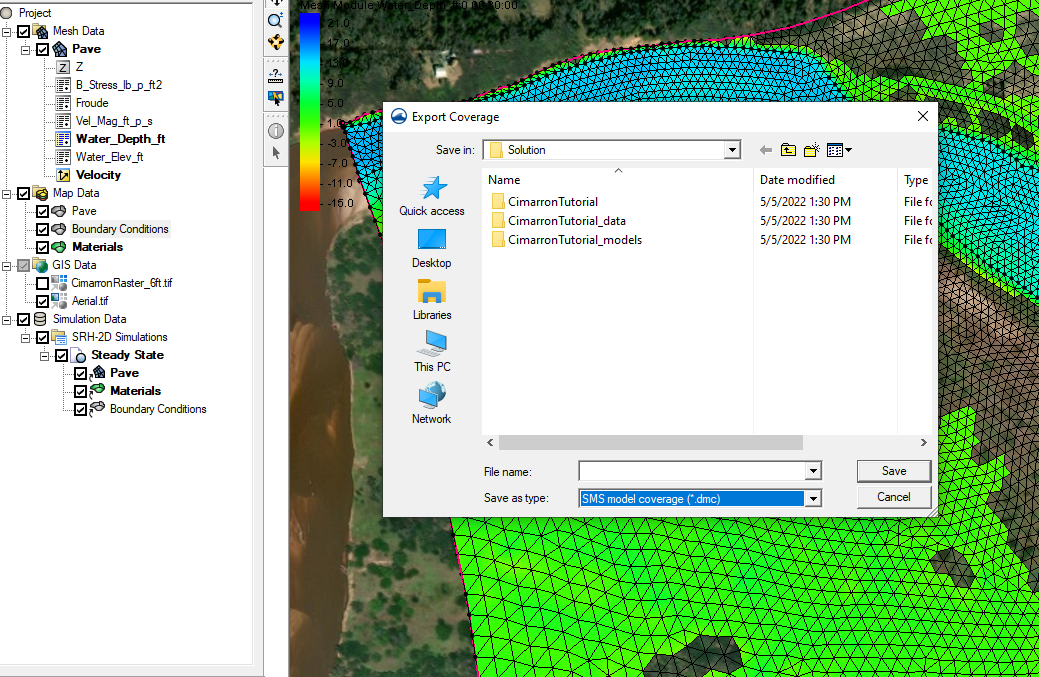
- Right-click on a coverage of your choice in the Project Explorer and select the Export command.
- In the Export Coverage dialog, change Save as type to be "SMS model coverage (*.dmc)".
- Save the DMC file.
The DMC file can now be imported into another project. Importing the DMC file will create a new map coverage in the project with all of the feature objects and attributes that were saved with the file.
It should be noted: Nearly all attributes in the coverage will be exported. The exception to this rule is that external files referenced by the coverage are not embedded in the model coverage file. An example of this would be an external tidal WSE source in a CMS-Flow BC coverage. The attribute would include the link to the file, but if the DMC file is read into a project on a different machine, the external file would not be in the same location, and therefore the association is automatically maintained.
It should also be noted that not all map coverage types can be exported as a DMC file. Certain older map coverage types do not have this option at this time.
Try exporting a DMC file and importing it into an SMS 13.2 project today!