Computing a Courant Number for an SRH-2D Model
By aquaveo on December 21, 2022Sometimes, you might want to calculate a Courant number for your SRH-2D model. In most cases, this isn't necessary because SRH-2D is an implicit model. Unlike explicit models such as HEC-RAS, SRH-2D is not Courant limited. With SRH-2D, it is more important to verify convergence and stability than Courant compliance. However, we know that calculating a Courant number dataset for SRH-2D is occasionally desired. Fortunately, SMS now has the Advective Courant Number tool to compute a Courant number dataset based on velocity.
First, let's be clear about what a Courant number does. A Courant number tells you the number of mesh elements that a given water particle passes through during a time step. If the Courant number is less than one, the given particle of water would not pass through an entire mesh element in a single time step.
In SMS, the Advective Courant Number tool computes a Courant Number dataset including every node at every time step. It uses the following equation:
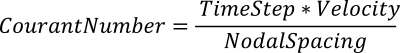
To use the Advective Courant Number tool, do the following:
- Make sure a transient SRH-2D solution file is already loaded.
- Open the SMS Toolbox, and under Datasets, find the Advective Courant Number tool.
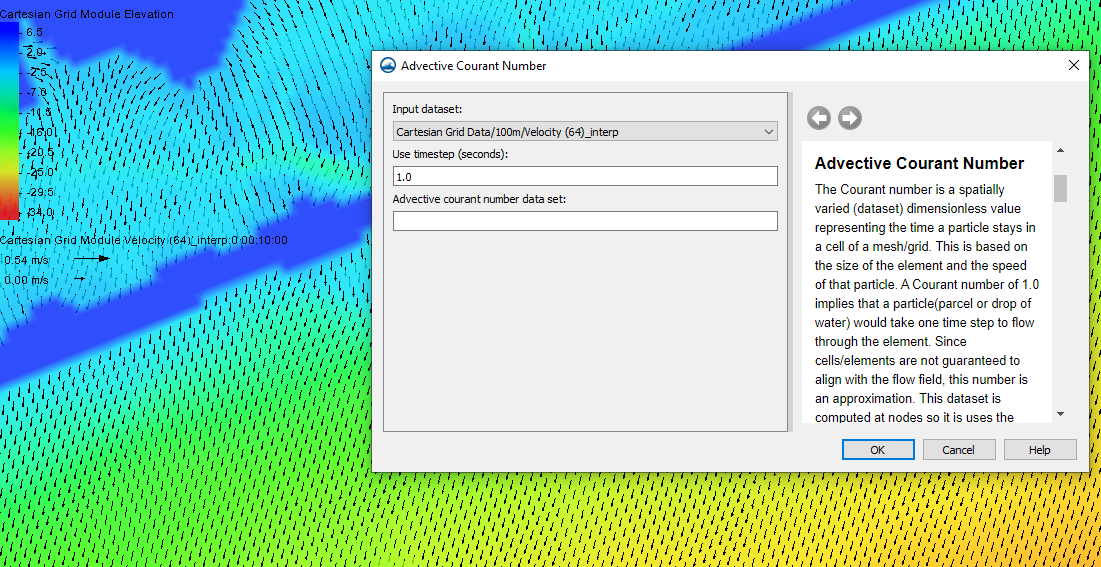
- Set the Velocity dataset, the time step length for the simulation, and the desired name for the output dataset.
- Run the tool.
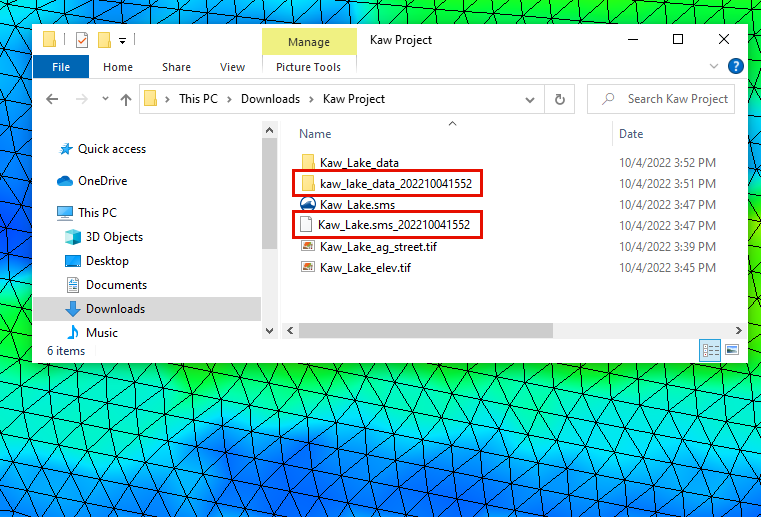
The Advective Courant Number tool might stall depending on the vector dataset for your SRH-2D simulation. Running the SRH-2D simulation again might solve this problem. Before running the simulation again, we recommend saving the project as a new file to preserve the old solution files. Then, in the new SMS project file, run SRH-2D again. Once the new solution is loaded into SMS, run the Advective Courant Number tool again using the new velocity dataset.
To see the results, open the Properties dialog for the Courant number dataset. There, you will find the maximum and minimum for the whole dataset and the current time step.
Calculate the Courant number dataset for your SRH-2D simulation in SMS today!