WMS

Using the Channel Calculator in WMS

With WMS there is no need to sit and calculate your channel properties by hand, you can use the Channel Calculator to help you obtain the hydraulic data you need. The Channel Calculator, a function of the Hydraulic Toolbox, has the ability to give values for flow, depth, area of flow, wetted perimeter, hydraulic radius, average velocity and so much more. Even better, the Channel Calculator only requires some basic cross-section data including the slope and either the flow or depth of the channel.

This blog post will cover how to compute depths for your channels, which can be used to create floodplain delineation maps, and also how to generate rating curves for your channels, which can be used for things such as predictions. To get started, make sure you have cross-section arcs and river centerlines in your model.

To Compute Depths:

The Channel Calculator is a good tool for approximating channel flows or flow depths. Given a flow rate, the Calculator can compute a flow depth, and vice versa.

  1. In the Hydrologic Modeling Module, select Calculators | Channels to open the Channel Calculations dialog.
  2. Toggle on the Use Cross-Section Database option to enable the ability to import existing cross-section data.
  3. Click the Select Cross Section button to bring up the Assign Cross-Section dialog.
  4. Select your cross-section file along with the cross-section you would like to work with.

The cross section displays in the small graphics window of the Channel Calculations dialog. Adjust the Z scale using the drop-down menu to better visualize the cross section. With the cross section selected, set the necessary parameters to perform calculations for depths.

  1. Click the Launch Channel Calculator button to open the Channel Analysis dialog.
  2. Enter a value for Longitudinal slope. This is an estimate for the ground slope in the vicinity of your cross-section.
  3. Enter a value for the Flow or the Depth depending on which values you have and which ones you are trying to find.
  4. Select the Calculate button. This will populate the right-side of the dialog with hydraulic values calculated for the cross-section.
  5. Select the Create Stage Point button in the Channel Calculations dialog to create a stage point based off the values computed in the channel calculator. This is useful if you are planning to use the depths to delineate a floodplain later on.
To Generate a Rating Curve:

The Channel Calculator can also be used to create different rating curves, to be used to calculate things such as storage potential.

  1. Click on the Launch Channel Calculator button to open the Channel Analysis dialog.
  2. Select the Compute Curves button to open the Curve Selection dialog.

The default is to create a rating curve for the entered flow vs. depth for the selected cross section, but it’s possible to also create curves for all of the other options listed.

  1. When exiting the Curve Selection dialog, the selected rating curves are generated and the plot shouldappear.
  2. If you double-click in the rating curve plot window a dialog will appear that presents many different options for how you can use the rating curve, including an option to export the curve in a chosen format.

As you can see, with just a few steps, you can obtain the hydraulic data you need for your channels in WMS. Try it out today!

Blog tags: 

Using GSSHA Group Files in WMS

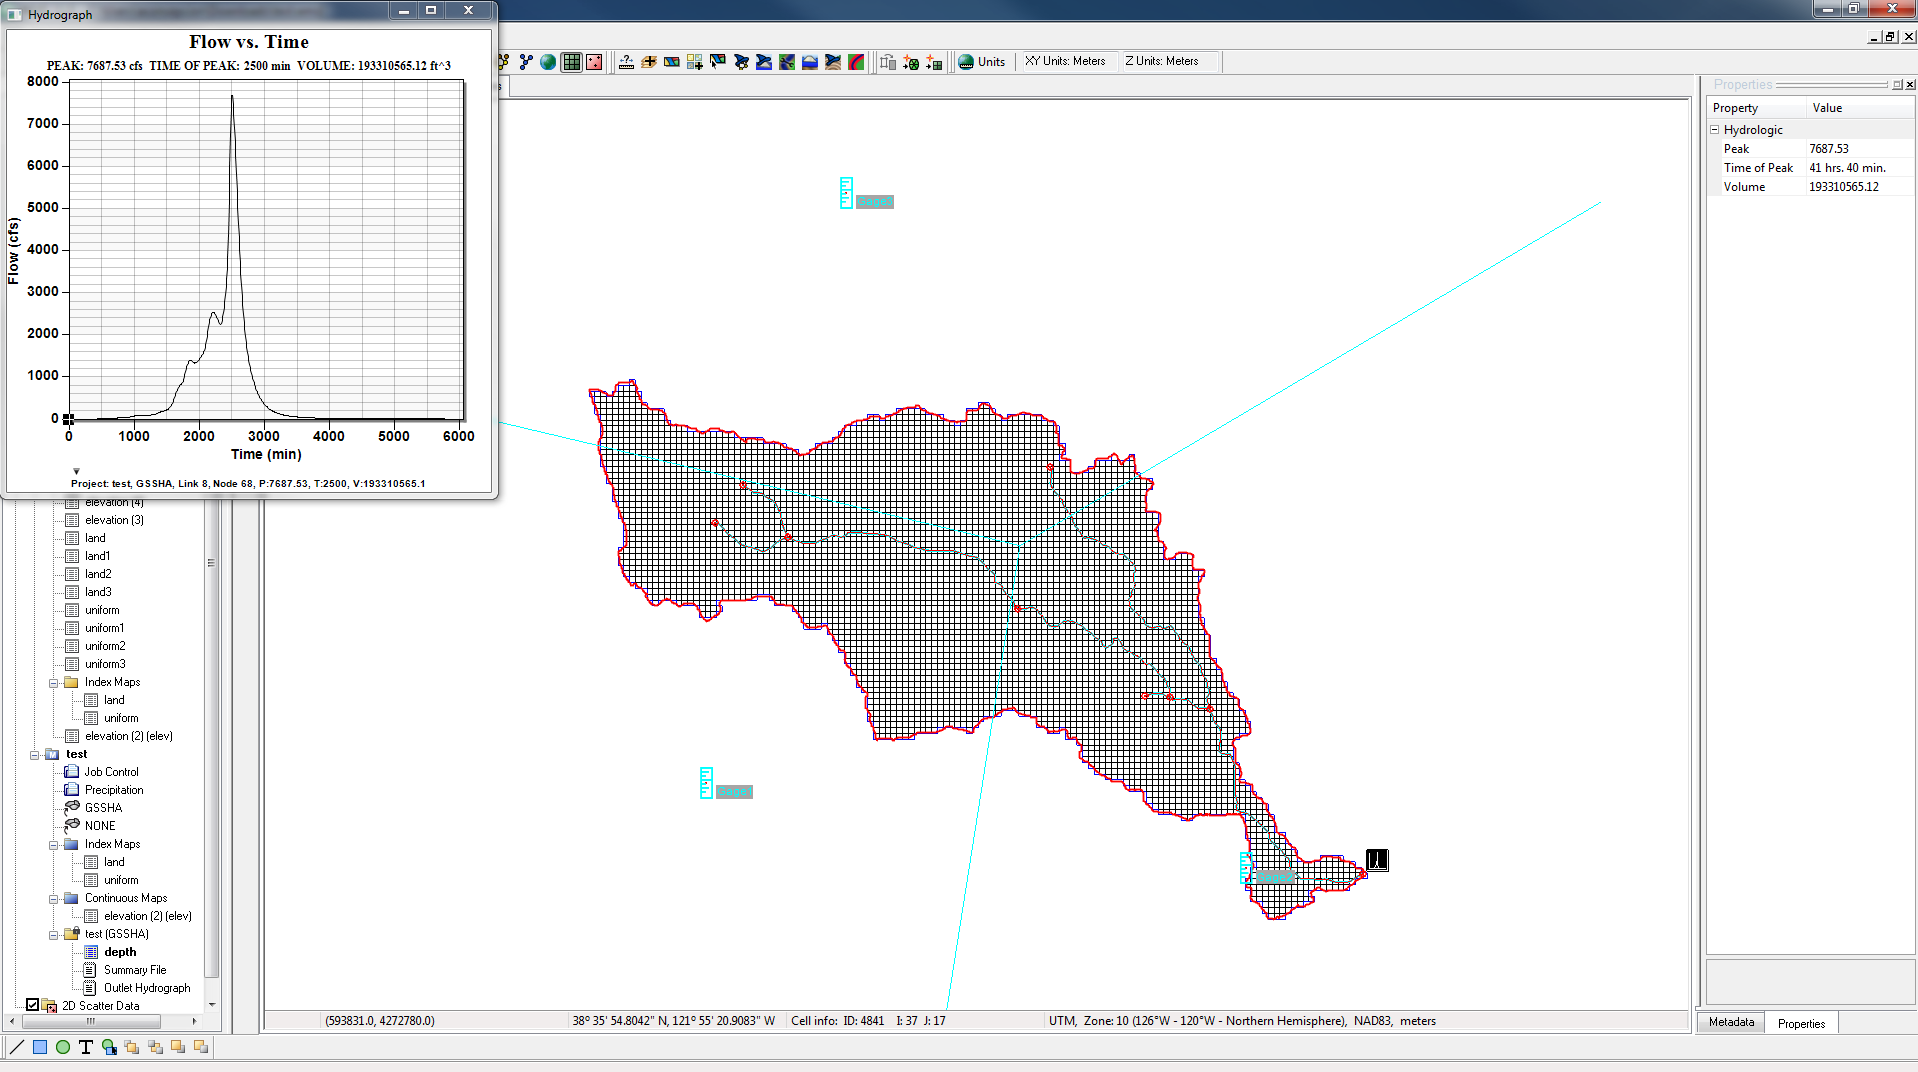
GSSHA Group files in WMS allow multiple GSSHA projects to be saved together in one set of files. It can sometimes be helpful for you to run GSSHA on multiple related projects in order to compare the results.
GSSHA

You can open multiple projects into one WMS session by doing the following:

  1. Open the first project using the GSSHA | Open Project File option.
  2. Open the second, third, ect., project using the same menu.

Once the desired projects are open in WMS, you can save them as a GSSHA Group Project (GGP) file. This keeps everything together in one location.

  1. Save the project as a group by using the GSSHA | Save Group option.
  2. Select the projects to include in the group.
  3. Give the group a file name.

GSSHA can be run on a group file if you do the following:

  1. Select the GSSHA | Run GSSHA Group option.
  2. Select the projects to run.
  3. Give the project a name.
  4. Select whether to suppress screen printing and/or to import the solutions when the GSSHA run finishes.

When GSSHA finishes running on the first project, the Model Wrapper dialog will automatically close. A few moments later, another instance of the Model Wrapper dialog will appear as GSSHA runs on the second project. This one will also automatically close. This continues this way through all of your selected projects. WMS will then import the solutions from the GSSHA runs.

All of the tips here require you to be in the 2D Grid Module—there are additional GSSHA menus in other modules. Additionally, warnings may appear asking if land use and soil type tables should be overwritten. This is up to your discretion. Keep in mind, however, that it is generally best to import projects in an additive manner, with the most simple project being imported first and the most complex project being imported last.

Try out saving and running GSSHA groups in WMS today!
Blog tags: 

Converting CAD Data to Feature Objects in WMS

CAD data has been around for a long time and it’s one of the most readily available formats for geological data. WMS can make use of the data in a variety of ways. One of these ways is to convert CAD data into feature objects.

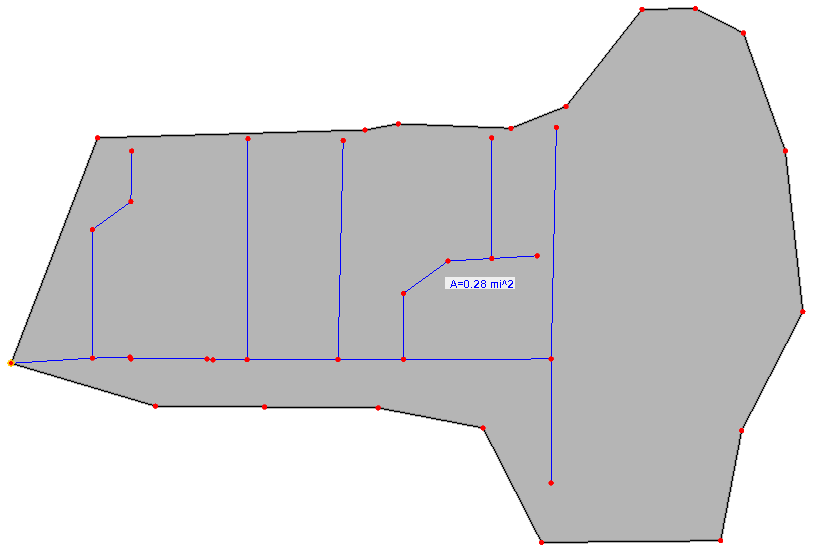
When CAD data for an area is available, DWG and DXF file data can be automatically converted to feature objects in WMS. Lines, points, and polygons in the CAD file can be turned into feature objects on a Map coverage for use in your WMS projects. This is done by doing the following:

  1. Import the CAD data into WMS. It will appear in the Project Explorer.
  2. In the Project Explorer, right-click on the CAD file and select CAD to | Feature Objects.
  3. In the CAD → Feature Objects dialog, select the layers to be converted to feature objects.
  4. Next, in the Clean Options dialog, select options to clean up the feature objects such as removing dangling arcs.
  5. Finally, the Properties dialog will appear letting you designate the type of coverage that will hold the new feature objects.

After you have converted your CAD data to feature objects, there are few items to keep in mind.

  • Typically, CAD data will not designate the stream direction. Make certain to check the direction of arcs generated from CAD data. Use the Reorder Streams command to fix this.
  • Polygons will not be automatically generated from polygons in the CAD data. Any enclosed arcs must be converted to polygons using the Build Polygons command.
  • It may be necessary to use the Clean Options dialog again after conversion.
  • Additional adjustments to the arcs may be necessary using the Map module tools.

Generating feature arcs from CAD data can save you a lot of time and frustration when building your watershed model. Try out converting CAD data into feature objects using WMS today!

Blog tags: 

Working with Rain Gages in GSSHA

Are you needing to add rain gages to your GSSHA model? Using rain gages to define your precipitation in GSSHA is extremely useful due to its ability to spatially model precipitation over a watershed. Combining spatially varying rainfall with the distributed parameters of GSSHA is a great way to create a fairly realistic model for your watershed.

One of the bigger challenges when simulating a storm event is finding reliable data. Although it is important to investigate the most accurate source for your particular watershed, there are websites containing NOAA and GLDAS data for not only the United States, but globally. Having many sources of compiled data all on one site makes Cuahsi’s HydroClient a very useful resource. For those using our software internationally, another possibly useful resource when gathering storm data from the Global Precipitation Climatology Centre. This gives monthly values from 1901-2013, with newer data being added frequently.

Now that you have solid data for your watershed, it is time to define your gages. To use rain gages as your precipitation input:

  1. Create a rain gage coverage.
  2. Create rain gages in their proper locations.
  3. Using the Select tool, double-click on the gage to bring up the Rain Gage Properties dialog.
    1. Set the gage type to GSSHA.
    2. Define the precipitation using either a cumulative or an incremental distribution.
    3. Beneath the Show drop-down, choose GAGES if your data is incremental, and ACCUM if your data is accumulative.
  4. Return to the 2D-Grid module and select GSSHA | Precipitation.
    1. Select Gage as the rainfall event, select Rain Gage, and choose your preferred interpolation method (Inverse distance weighted or Thiessen polygons).

For more information and specifics on working with gages in GSSHA, please take a look at the GSSHA user’s manual. WMS provides a useful and helpful resource when creating a GSSHA model, analyzing and viewing the results. Practice using rain gages as your precipitation source in WMS 11.0 today!

Blog tags: 

Pages