GMS

Using the MODFLOW HFB Package

Sometimes in a MODFLOW simulation, you need to simulate very thin barriers to flow that aren't accurately represented by assigning values to entire cells. Fortunately, MODFLOW has the Horizontal Flow Barrier (HFB) package that facilitates accurately modeling thin flow barriers. Today, we explore how the HFB package can meet your needs, and how it functions.

The HFB package can meet your need for a more realistic approach to simulating horizontal barriers in your model. Whereas many packages in MODFLOW assign values to entire cells, that might poorly reflect reality for horizontal flow barriers with negligible width. These barriers might include slurry walls, sheet pile walls, or diaphragm walls around wells. Instead of assigning values to whole cells, the HFB package uses cell boundaries to simulate horizontal barriers. Doing so can more accurately reflect the actual situation.

To use cell boundaries to simulate horizontal flow barriers, the HFB package uses a hydraulic characteristic. You calculate the hydraulic characteristic by dividing the hydraulic conductivity of the barrier by the real-life width of the barrier. This value is assigned to cell boundaries. Then, MODFLOW uses that value to modify the regular flow between cells. Thus, you get modified flow at the cell boundaries that have a defined hydraulic characteristic.
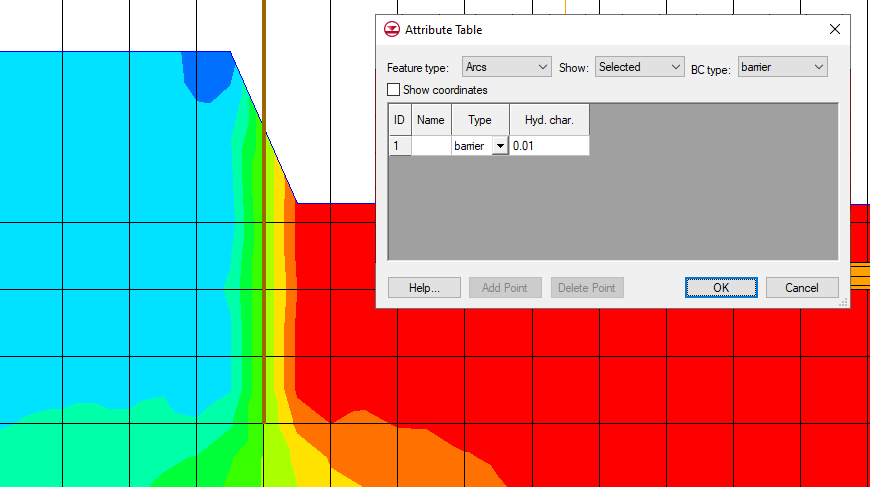
Example of the HFB Package in GMS

The following is a suggested workflow for using the HFB package:

  1. Make sure that the HFB package is turned on in the MODFLOW Packages / Processes dialog.
  2. Set up a coverage that can include a barrier by checking Barrier in the Coverage Setup. Define the layers that the barrier affects using the Default layer range in the Coverage Setup.
  3. Draw an arc representing the barrier. In the Attributes table for that arc, set its boundary condition to "barrier". Define its Hydraulic characteristic as you have calculated it.
  4. Map from that coverage to MODFLOW.

The values for the HFB package can be edited using the HFB - Horizontal Flow Barrier command in the MODFLOW menu.

While using the HFB package, keep the following in mind:

  • There are certain assumptions that this package uses to function. It's assumed the barrier has no storage capacity. It's also assumed the barrier has negligible width. Therefore, the HFB package's sole function is to reduce conductance between adjacent horizontal cells.
  • This blog post primarily applies to standard MODFLOW versions. The HFB package is also available for MODFLOW 6.

Try out the HFB package in GMS today!
Blog tags: 

Exporting Contour Shapefiles from a 3D UGrid

Have you ever wanted to export the linear contours on a 3D UGrid as a shapefile? By exporting GMS contours as shapefiles, you can open contour shapes in other GIS applications or in other GMS projects. GMS provides functionality for exporting UGrid contours to shapefiles. This article gives some guidance for using this functionality.

In GMS, linear contours display on the top and the bottom of the 3D UGrid. This can result in contour shapefiles with undesired shapes that make contours unclear. Fortunately, GMS 10.7 can now display just one cell face (top or bottom) of single layers in a 3D UGrid. This enables exporting cleaner contour shapefiles from one face of a layer in a UGrid.

For example, GMS can display just the top of layer 1, or it can display just the bottom of layer 3. This can make for cleaner contour shapefiles because the files will have contours from only one face of the 3D UGrid. This is useful if you want the contours from a UGrid but only need the top- or bottommost contours.

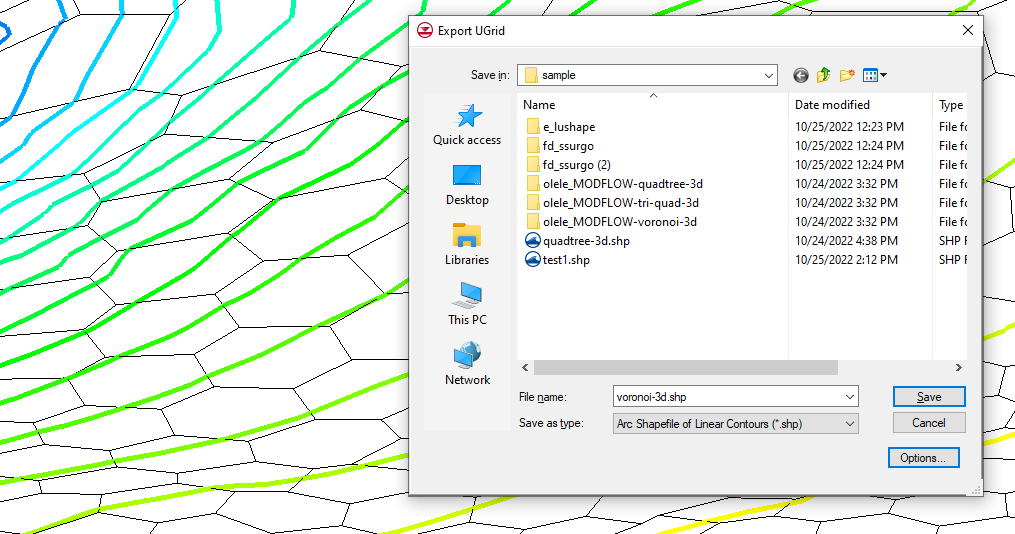
Example of exporting UGrid contours to a shapefile

Do the following to export contour lines from one face of a UGrid layer as shapefiles:

  1. Have a 3D UGrid visible in the Graphics Window. Make sure that it has a dataset that can be visualized using contours.
  2. Activate the desired dataset.
  3. Set the contours to linear in the dataset Display Options.
  4. Turn on Single layer in the UGrid Single Layer toolbar and select the desired layer. By default, the UGrid Single Layer toolbar is to the right of the XYZS Bar at the top of the GMS window.
  5. Adjust the drop-down in the UGrid Single Layer toolbar to show the cell faces desired: top, bottom, or all. GMS displays the top faces by default. This also adjusts which contours display. Now you have a certain set of contours singled out. These will be made into contour shapefiles.
  6. Right-click on the active UGrid and select Export.
  7. In the Export UGrid dialog that appears, select "Arc Shapefile of Linear Contours (*.shp)" from the Save as type drop-down and save the contour shapefile with the desired name.

If you move the shapefiles, make sure to move them with all of their accompanying files. That includes the files ending in "*.dbf", "*.prj", and "*.shx".

There may be breaks in the displayed faces of the UGrid when only showing the top or bottom face of a layer. This is because some adjacent cells are joined only by vertical cell faces; the edges of the top or bottom of the cells don't touch. Thus, when the vertical cell faces are hidden, there is only empty space. This often affects the display of the contours and the contour shapefiles.

Try exporting your UGrid contours as shapefiles in GMS 10.7 today!

Blog tags: 

Switching Model Executables

The Groundwater Modeling System, Surface-water Modeling System, and Watershed Modeling System (collectively known as XMS) applications make use of multiple numerical models. XMS is packaged with the executables for each of these numerical models. At times, you may need to switch out which numerical model executable XMS uses.

In general, you will want to use the model executable that comes packaged with the XMS. XMS is coded to work with the specific model executables that are distributed with each version of the software.

There are some reasons you might want to change which model executable it used. It might fix a bug with the model executable. It might get you access to features in an older or newer version of the model executable. It might also help you test issues with the numerical model. Replacing the model executable isn't guaranteed to help with any of these, but it is one option for troubleshooting with all of them.

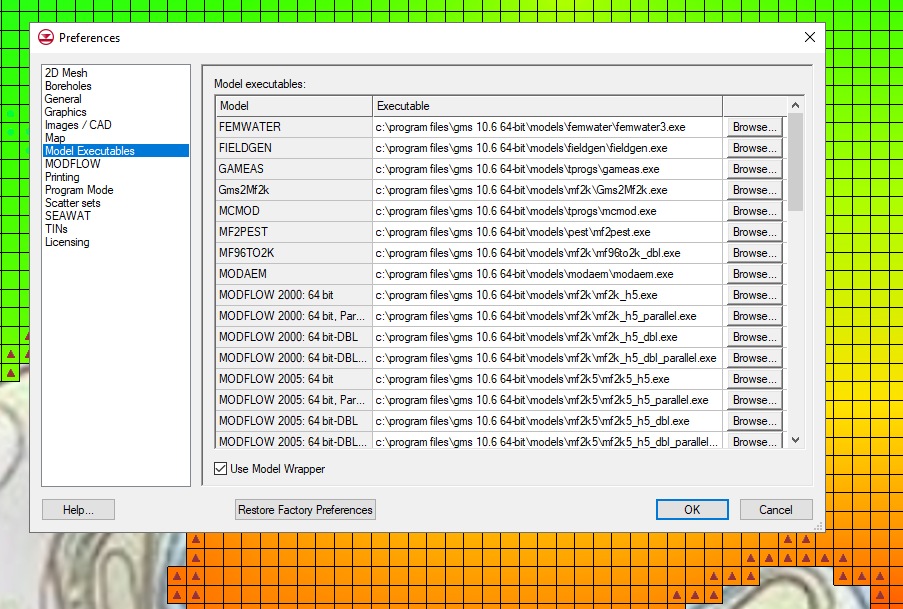
For all XMS applications, the numerical model executables to be used are selected in the Preferences dialog. If you already know where the model executable is, you can copy and paste the executable into the preferences dialog. To do so, use the following workflow:

  1. Copy the executable file path. If using Windows 11, right-click on the desired model executable and select "Copy as Path."
  2. If using Windows 10, open the Properties dialog from the right-click menu. Copy and paste the location path into a text document. Then, make sure to grab the file name ending in ".exe" as well. The executable path will be incomplete without that file name.
  3. In your XMS software, open the Preferences dialog from the Edit menu.
  4. Find the model executable that you want to change and click on the file path next to the name or the Browse button.
  5. In SMS or WMS, this will bring up an Open dialog. In the File name box, paste in the new executable path. If you are using Windows 11, make sure to delete the quotation marks at the beginning and end. Selecting Open saves the new model executable.
  6. In GMS, the model executable is editable without bringing up the Open dialog. Simply erase the former executable path and paste in the new one. As long as the path is a valid path and the path ends in ".exe", GMS will save it. Again, for Windows 11, delete the quotation marks.
  7. Finalize the model executable by clicking OK to exit the Preferences dialog. Otherwise, the executable will not save.
Example of model executables in the Preferences dialog

Now, there are some issues to keep in mind. As mentioned earlier, changing out a numerical model executable is not guaranteed to fix a particular issue or even improve the situation. Older or newer versions of the model executable may not always be compatible with your version of XMS. Sometimes the model executable is not compatible with a particular project. The new executable might even worsen the situation. If any of these things happen, you can reintroduce the original executable.

Check out the available model executables in XMS today!

Blog tags: 

Creating UGrid Cross Sections in GMS

GMS 10.7 has added functionality for creating and viewing cross sections on unstructured grids (UGrids) in your GMS project. This article discusses this added functionality for creating UGrid cross sections and some things to keep in mind while using it.

You can use it anytime you want a quick view of the inside of a UGrid. Perhaps you want to review the contours of a MODFLOW 6 dataset or the materials in a specific section of a UGrid. With the Create Cross Section tool, you can quickly create a cross section that visualizes these values.

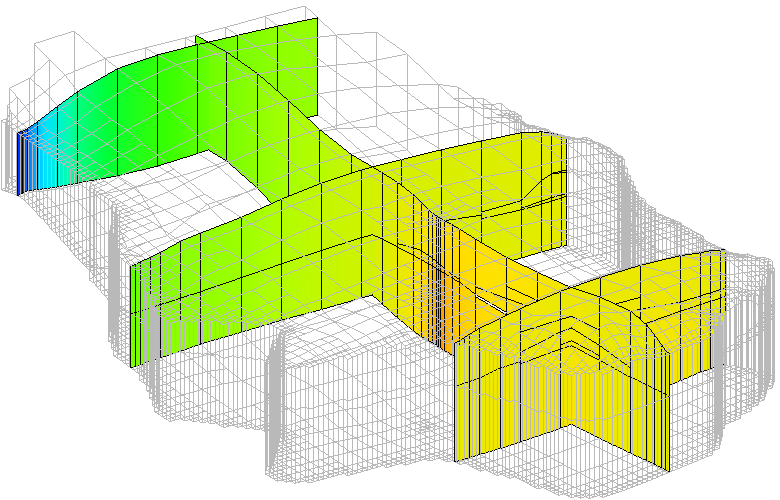
To use this tool, go to the UGrid Module in GMS and select the tool called Create Cross Section. Then, click out a line across your 3D UGrid in the GMS Graphics Window. This creates a new UGrid cross section, and a new cross section item appears in the Project Explorer under the active UGrid.

UGrid Cross Sections in GMS

Depending on the display options you choose, it may be necessary to hide the UGrid to see the cross section you created. You can hide the UGrid by clicking the checkbox next to it in the Project Explorer. Even though the cross section is categorized under the UGrid in the Project Explorer, the cross section does not disappear when the UGrid is hidden. Another option for visualizing the cross section is to turn off face contours and cell faces in the display options for the active UGrid.

Regardless of the length of the line you click out, the Create Cross Section tool will create a cross section along your line from one end of the UGrid to the other. This tool does not create partial cross sections.

Moreover, this tool only creates cross sections on the active UGrid, even if other UGrids are visible and the active UGrid is not. Every UGrid cross section drawn is saved under the currently active UGrid in the Project Explorer.

If you accidentally create a cross section, it can be easily deleted by selecting it and using the delete command. This also allows you to create a UGrid cross section to quickly verify something, but then delete it just as quickly. It does not show up in your final model if you don't want it to.

These cross sections have a separate display options dialog that is accessed individually by right-clicking on the cross section in the Project Explorer. In the display options, the elevation offset for the UGrid cross section can be set. This allows for the cross section to appear above the UGrid for viewing. There are also options that allow you to decide which dataset the cross section contours represent. Many of the options relating to things like contours and cells are accessed by clicking the button labeled Other Display Options.

Creating UGrid cross sections makes visualizing 3D UGrid data more straightforward than before. Try the Create Cross Section tool in GMS 10.7 today!

Blog tags: 

Pages