GMS

Creating a Transient Animation

After creating a transient dataset, it can be time consuming to click through each time step to evaluate the changes over time. One of the fastest ways to view changes in transient data is to create an animation.

Creating an animation in GMS can be done quickly using the Animation Wizard.

Once you have a transient dataset with multiple time steps in your project, do the following:

  1. Select the dataset you want to animate and make certain your project is displayed how you want to see it in the Graphics Window. The animation will be created from what is visible in the Graphics Window.
  2. Select the Animate command in the Display menu to open the Animation Wizard.
  3. In the first part of the Animation Wizard, select where you want to save your animation, what file type you wish to use and the animation quality.
  4. In the second part of the Animation Wizard, set your time duration and add a display clock. The options here will vary depending on what options were selected in the first part of the Animation Wizard.
  5. When you click Finish, GMS will create your animation.

If you selected the AVI file format, GMS will display it for you in the Play AVI Animation application (Pavia). This player is included with your installation of GMS. If you selected the KMZ format, GMS will display your animation in Google Earth (if it is installed).

Once you’ve created an animation, you can view it again when you reopen the project. To do this, select the Play Animation command in the Display menu. This will tell GMS to locate the animation file associated with the project and open it in the AVI player. This operation only works for AVI files.

Files can be exported in either AVI format or KMZ format. The AVI file can be used with most other video players, including Windows Media Player or QuickTime Player. KMZ files can be opened with Google Earth.

With the basics down, you can now try creating animations for your own projects in GMS.
Blog tags: 

Adding Notes in GMS

It happens from time to time—part of your groundwater model has something special that needs mentioning before handing it over to someone else. You may want to differentiate between two similar coverages without giving them long names, you may need to describe the real world source of a scatter set, or you need to explain how a quadtree was generated.

GMS provides an effective way to add notes to objects and datasets in order to aid in model development. There are two ways to add notes to objects in GMS.

The first is to add notes to object properties by doing the following:

  1. Right-click on an object in the Project Explorer and select the Properties command.
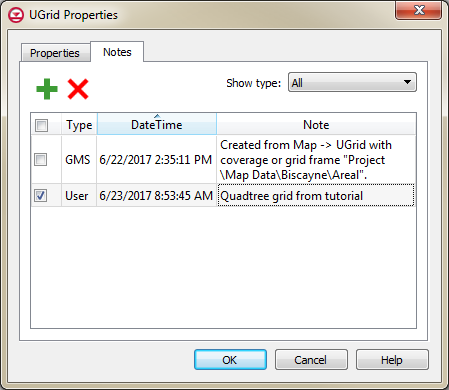
  2. In the Properties dialog, click on the Notes to tab to see all notes associated with the object.
  3. Click on the Add Row button to create a row where you can add your notes. The date and time you enter the note will automatically be added.

GMS can also automatically create notes when UGrids, datasets, and coverages are created. Using this feature requires that the Create GMS Notes Automatically option be turned on in the Preferences dialog.

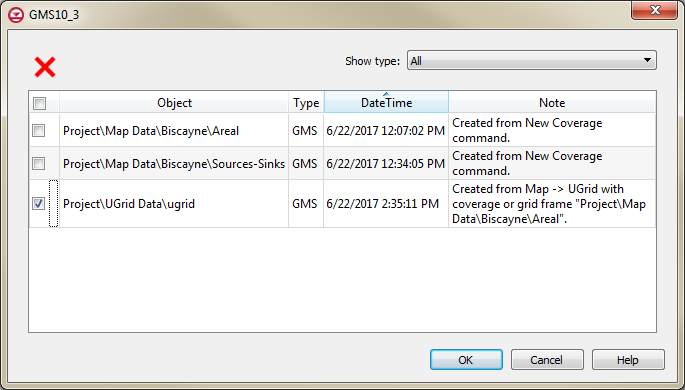
As your project grows, you may find some notes are no longer needed. You can delete notes by going into the Properties dialog and deleting notes individual. If you have several notes that need to be removed, deleting them individually could be a hassle. GMS makes it easier by placing all notes contained in a project into one location.

  1. Select the Notes command in the Edit menu to bring up a dialog with all notes made in the project.
  2. From this dialog, you can select and delete multiple unwanted notes.

Now that you’ve seen how to create notes, try adding notes to your projects in GMS 10.3.

Blog tags: 

GMS MODFLOW and ArcHydro Training in Yerevan, Armenia

In January, Aquaveo sent Alan Lemon to Yerevan, Armenia to conduct a training course on using MODFLOW in GMS, and using ArcHydro Groundwater. The training covered the basics of using both GMS and ArcHydro Groundwater, as well as some specifics on how these tools could be applied in Armenia to help increase the efficiency of groundwater resource management. These trainings are very hands-on, which helps the participants more quickly learn how to use the tools.

Topics demonstrated and discussed included learning how to build customized AHGW geodatabases, and how to import, manage, and visualize various types of data for structures such as boreholes. The training also covered importing, editing, and visualizing 2D and 3D hydrogeologic models complete with cross sections and maps showing water levels and quality.

Members of the course included representatives from the Water Resources Management Agency and the Environmental Monitoring and Information Center of the Ministry of Nature Protection (MNP), Institute of Geological Sciences of the National Academy of Sciences of Armenia, the International Agribusiness Teaching Center at Armenian National Agrarian University, the American University of Armenia, and Yerevan State University.

This training was arranged by ME&A (Mendez England & Associates) as part of their ASPIRED (Advanced Science & Partnerships for Integrated Resource Development) program. We appreciate their help in arranging the training, and we appreciate the time and effort of all of the ministry and university participants. Despite having to work through a translator, all of the participants were focused and engaged, and a good rapport was developed.

We had a very enjoyable time there. To schedule your own onsite training course, visit the Aquaveo site today.

Blog tags: 

6 Ways to Select 3D Cells

When using a 3D grid in GMS, it’s likely you will need to select a grid cell at some point in the project. This is usually a straightforward procedure. However, sometimes the 3D nature of the grid makes it less obvious as to which cells are selected.

To cover the basics of selecting cells, here are six ways to select 3D grid cells in GMS.

1. Select Cells Tool

The Select Cells tool is the most obvious choice and the tool most often used to select cells in a 3D grid. The tool can be used to select multiple cells by clicking and dragging a box over a group of cells. Multiple cells can be selected by using using the Shift or Ctrl keys. Select one cell, hold down the Shift key, and select a second cell to select both cells and all the cells in between. If you want to select cells without getting all the cells in between, use the Ctrl key.

Using the Select Cells tool only selects the visible cells, so be certain you are on the correct layer of your 3D grid. It will not select the cells underneath.

2. Select i, Select j, and Select k Tools

These tools are a lot like the Select Cells tool and operate in a similar way. The only difference is these tools will select entire rows or even entire layers. These tools depend on the view you are in and the layer being shown.

For example, if using the Select i tool, one or more rows can be select when in plan view. Only rows on the visible layer will be selected. When switching to a front view, the Select i tool will select all visible cells because all of the cells are active in the i direction of the 3D grid.

Unlike the Select Cells tool, the Shift key functions like the Ctrl key when selecting multiple rows of cells.

3. Select All

This tool does what it says. The Select All command under the Edit menu, will select all visible cells in the 3D grid. If the view is changed (e.g., from front view to plan view), all cells will be deselected. This command can also be accessed by pressing Ctrl+A on your keyboard.

4. Select With Poly

Dragging a box over a group of cells is nice, but sometimes you need a little more precision. Using the Select With Poly command in the Edit menu will let you click out a polygon shape to define your selection area. Double-clicking ends the process and reverts back to whatever tool you had previously selected.

5. Select By ID

Do you have a specific cell you want to select, for example the location of a well or perhaps you received an error message about a cell when running a model check? If you know the cell ID or the location, you can use the Select By ID command under the Edit menu. This brings up the Find Grid Cell dialog where you can enter the cell ID or location. When done, you’ll find the cell has been selected. This tool does require that the cell be visible in the Graphics Window.

6. Select By Dataset Value

Sometimes there is a range of cells you’d like to select which contain a specific set of values. This can be done by using the Select By Dataset Value command in the Edit menu. Be certain the dataset with the values you want to select is active before using this command. It will bring up the Select by Dataset Value dialog where you can specify selecting cells with a certain value range.

There are other ways to select cells in GMS, but these are the most common methods. Check out the selection options for 3D grids in GMS today!

Blog tags: 

Pages