Using SRH-2D Monitor Plots and Structure Plots
With the release of SMS 13.1, we have added the ability to generate monitor plots and structure plots from the solution of a successful SRH-2D model run. This post will offer a brief rundown of these new features and a brief explanation of how to use them.
SMS now has the ability to generate solution plots at monitoring locations or structure locations, using solution datasets generated during the model run. If you make any edits to the coverage after running SRH-2D, make sure to rerun SRH-2D with the updated coverage to keep the plots consistent with the SRH-2D outputs.
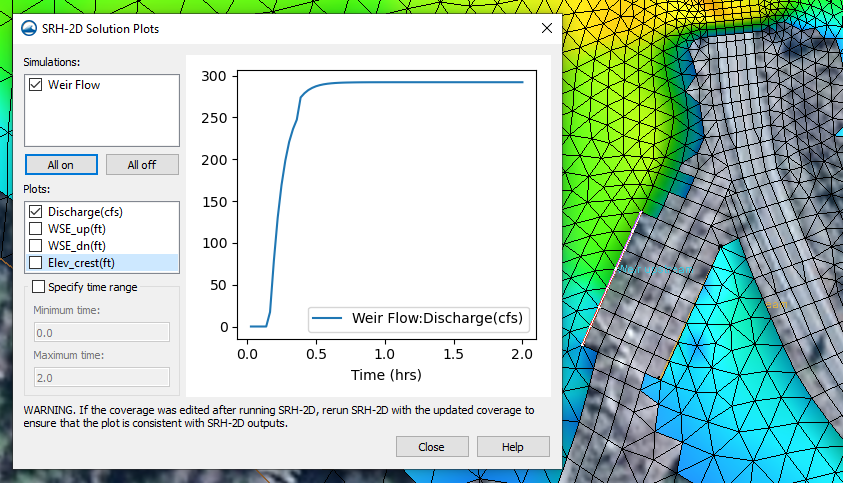
For both plots, they will be displayed in an SRH-2D Solution Plots dialog, and they will have similar options in both cases. These options include:
- Simulations: contains a list of all available simulations where the monitor or boundary conditions coverages were included during the simulation run. Select which solution set to use for the plot.
- Plots: contains a list of all available solution datasets from the model run. Datasets you select will appear in the plot.
- Specify time range: specify the time range for the plot to display. The possible range will be from 0 to the length of the entire simulation.
To use the monitor plots:
- Make sure you are in the monitor coverage and select a monitoring point or line.
- Right-click to select the Monitor Points Plot or Monitor Lines plot command.
This will open the SRH-2D Solution Plots dialog. Note, you need to make sure the monitor coverage was included in the simulation run, and that only one point or line is selected.
To use the structure plots:
- Make sure you are in the boundary conditions coverage and select a structure arc.
- Right-click to select the Structure Output Plots command.
This will open the SRH-2D Solution Plots dialog. Note that you need to make sure the boundary conditions coverage was included in the simulation run, and that only one structure arc is selected, even for structures that require two arcs.
Try using monitor plots and structure plots in SMS 13.1 today!


