GMS

How to Export Contour Lines as Shapefiles

Have you been wanting to export the contour lines in your GMS project as a shapefile so they can be opened in a different application? GMS allows exporting contour lines as a shapefile. Shapefiles are a file format used by many different GIS software applications. This post will explain how to export contour lines as shapefiles.

GMS contains the Layer Contours → Shapefile command to help save contour lines as a shapefile. Using this command requires your project to be set up correctly. Use the Layer Contours → Shapefile command by doing the following:

  1. Make sure the contours you want to convert to a shapefile are set to Linear in the Display Options. This can be accomplished by opening Display Options and clicking on Contours. In the Contour Method in the top left make certain in the dropdown that it is set to Linear.
  2. Make sure your Grid module is active in GMS, this can be done by clicking on the grid in Project Explorer or selecting the Grid module macro. The grid should be highlighted, meaning that it is now active.
  3. Go to the Grid menu and select the Layer Contours → Shapefile command. Use the dialog that appears to save your shapefile. Be sure to place it in the correct folder and name it properly. Otherwise you might lose the file.
  4. Now open your shapefile in the appropriate GIS software. The contour lines will appear as arc lines.
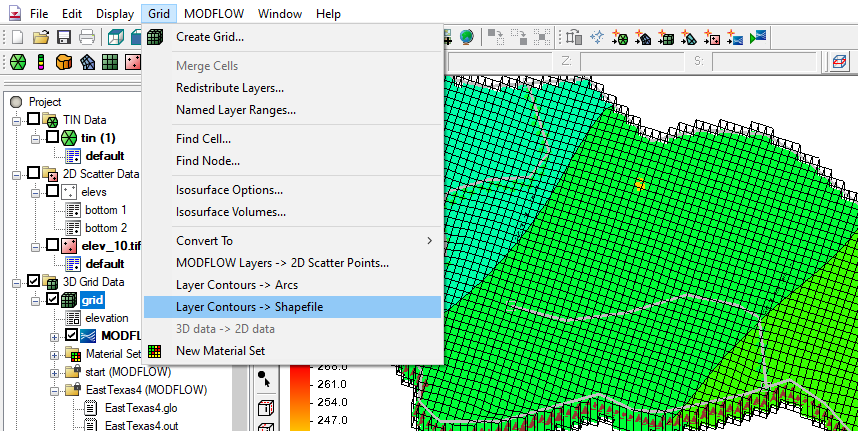
The Contour Lines to Shapefile Command

If you encounter issues with the shapefile, start with checking the folder where you saved the file. Make certain that all of the necessary files for the shapefile are there, including a projection file. Another item to check is that everything you want in the shapefile is displayed correctly in the Graphics Window before you export. Use the display options to adjust the contour lines if needed. Finally, there may be some differences between how GMS displays a shapefile and how other GIS applications display the shapefile. Opening the shapefile in GMS can help you determine if this is the case.

Try out converting contour lines to shapefiles in GMS today!
Blog tags: 

New Features in GMS 10.6 Beta

Aquaveo is pleased to announce the release of the Groundwater Modeling System version 10.6 in beta! With this beta release, GMS contains changes and improvements to various features, much of it involving increased support for MODFLOW 6 functionality. We’d like to highlight some of the new functionality you can expect to find in GMS 10.6 beta.

Transport Support for MODFLOW 6

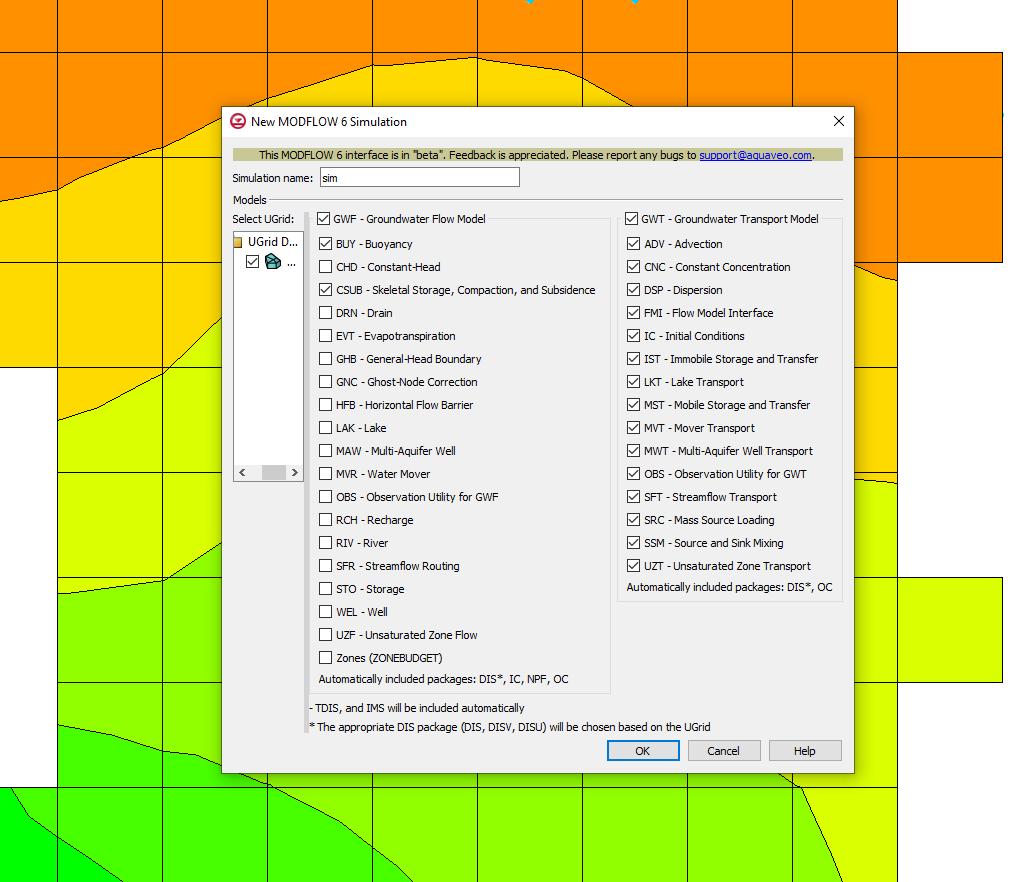
GMS 10.6 beta adds the ability to work with transient models for MODFLOW 6, as demonstrated by the addition of transport packages relevant to the GWT (Groundwater Transport Model) package. These will be helpful to many different aspects of groundwater transport modeling, such as dealing with advection, constant concentration, and dispersion. With the wealth of packages this alone adds to GMS 10.6 beta, it will add a lot of functionality to what GMS can do with MODFLOW 6 simulations.

Example of the new MODFLOW 6 Simulation dialog
Increased GWF Package Support MODFLOW 6

In addition to the suite of transport-related packages that GMS 10.6 adds to work with, support has also been added for more packages relevant to the GWF (Groundwater Flow Model) package. In this case, this includes the addition of the BUY (Buoyancy) and CSUB (Skeletal Storage, Compaction, and Subsidence) packages. The addition of these packages will help flesh out what GMS 10.6 beta can do with MODFLOW 6 simulations.

Support for Exchanges in MODFLOW 6

Support has also been added in GMS 10.6 for exchanges. These include the GWF-GWF and GWF-GWT exchanges. These can be used to help different models in a GMS project interact, and designate the nature of how they should interact. GWF-GWF exchanges can help two different GWF models interact together and hydraulically connect, telling each model that there is flow along a shared edge. GWF-GWT exchanges can help designate which GWF and GWT models should interact with each other.

These are just a few of the new features and changes coming out as part of the release of GMS 10.6 beta. You can find more information on what will be introduced in GMS 10.6 beta by going to the Aquaveo XMS Wiki. Try out these features and more by downloading GMS 10.6 beta today!

Blog tags: 

Avoiding Grid Over Refinement in GMS

When building a grid for your groundwater model, it can certainly be tempting to make a really refined grid. While this temptation is understandable, there are certain pitfalls that can result from having a grid that is overly refined. This post will go over some of the reasons to avoid overrefining your grid in GMS.

There are, of course, legitimate reasons to refine portions of your grid. Portions of the grid that are key areas should be refined. This should be done only in areas around wells or other structures that are important to the model. By refining key areas, important areas of the grid will receive more attention during the model run. However, over refining your grid can cause some issues, including some of the following ones listed here.

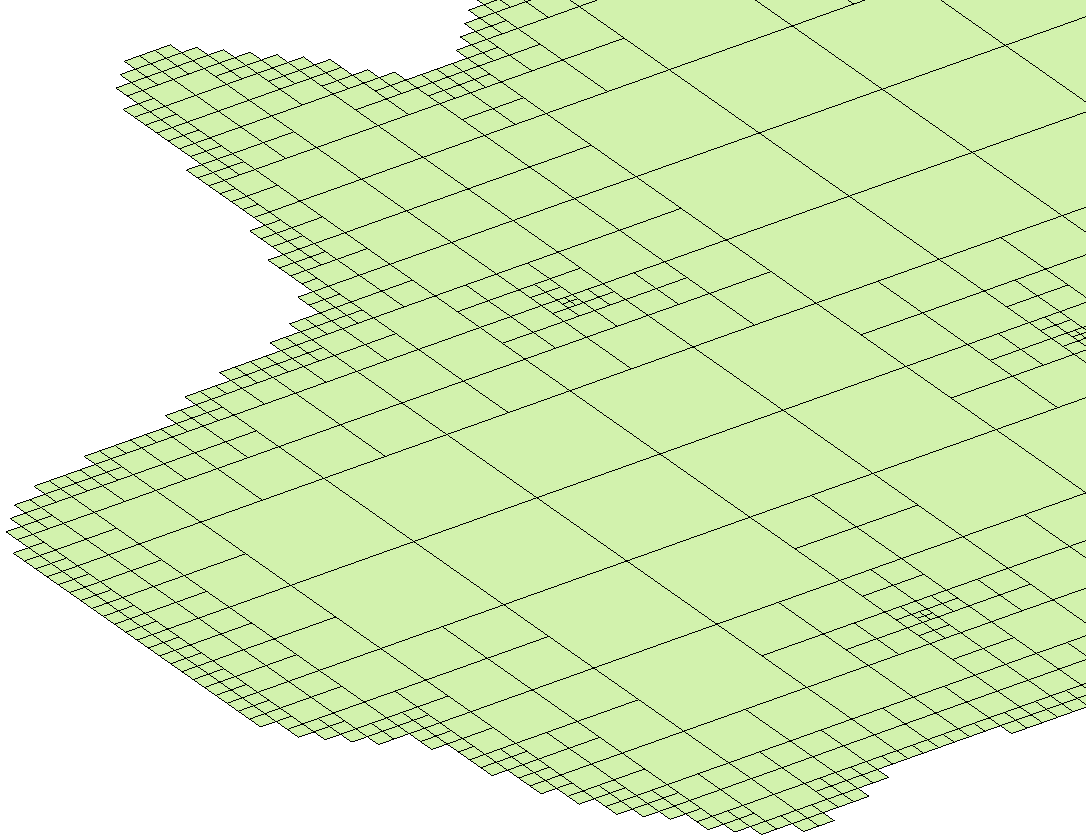
Example of Grid Refinement

When you are refining, you are creating more grid cells in your grid. Each of these cells will be used in the model run calculation. A grid that has been over refined generally has a lot of cells that need to be used in the model calculations, many of which are unnecessary. This will cause the model run to go slower and take longer than the same model without the over refinement.

Because an over refined grid contains refined cells in unimportant areas of the project, the data from these areas can sometimes skew the results. The model run does not generally discriminate between important and unimportant parts of the grid. When it encounters a portion of the grid that has a lot of cells, it gathers all the data it can for that area. In an over refined grid, this can mean it gathers more data than the model needs, which sometimes can skew the results.

The biggest issue we most often see is when over refined grids cause the model to fail to converge. Once again, an over refined grid will have too many cells and be collecting too much nonessential data. All of this can overwhelm the model and can cause the model run to diverge. To resolve this, you will need to simplify the grid so that the model run stays focused on the key areas of the model.

Try out some of these tips while refining grids in GMS 10.5 today!

Blog tags: 

Using the Axes Display in GMS

Have you tried using plotted axes to help orient the display of your models in the Graphics Window for your groundwater modeling projects in GMS? Within the Display Options in GMS, there is a set of options that will allow users to activate this and modify how it will display. This post will review how to utilize the Plot Axes functionality found in the Display Options dialog within GMS.

To locate the Axes options in GMS, open up the Display Options dialog by doing the following:

  1. Click the Display Options macro or go to the Display | Display Options... command.
  2. Select the Axes option on the left.
  3. Turn on the checkbox labeled "Enable axes" to activate the plot axes.

By default, the axes are turned off, and all the other options below it grayed out as a result. This is why axes are not usually visible on their own in the Graphics Window. Turning this option on will generate axes within the Graphics Window. The axes will naturally be sized to contain the entirety of the model within it. If the Graphics Window is currently set to Plan, Front, or Side View, rotation might be required for all of the axes to be visible.

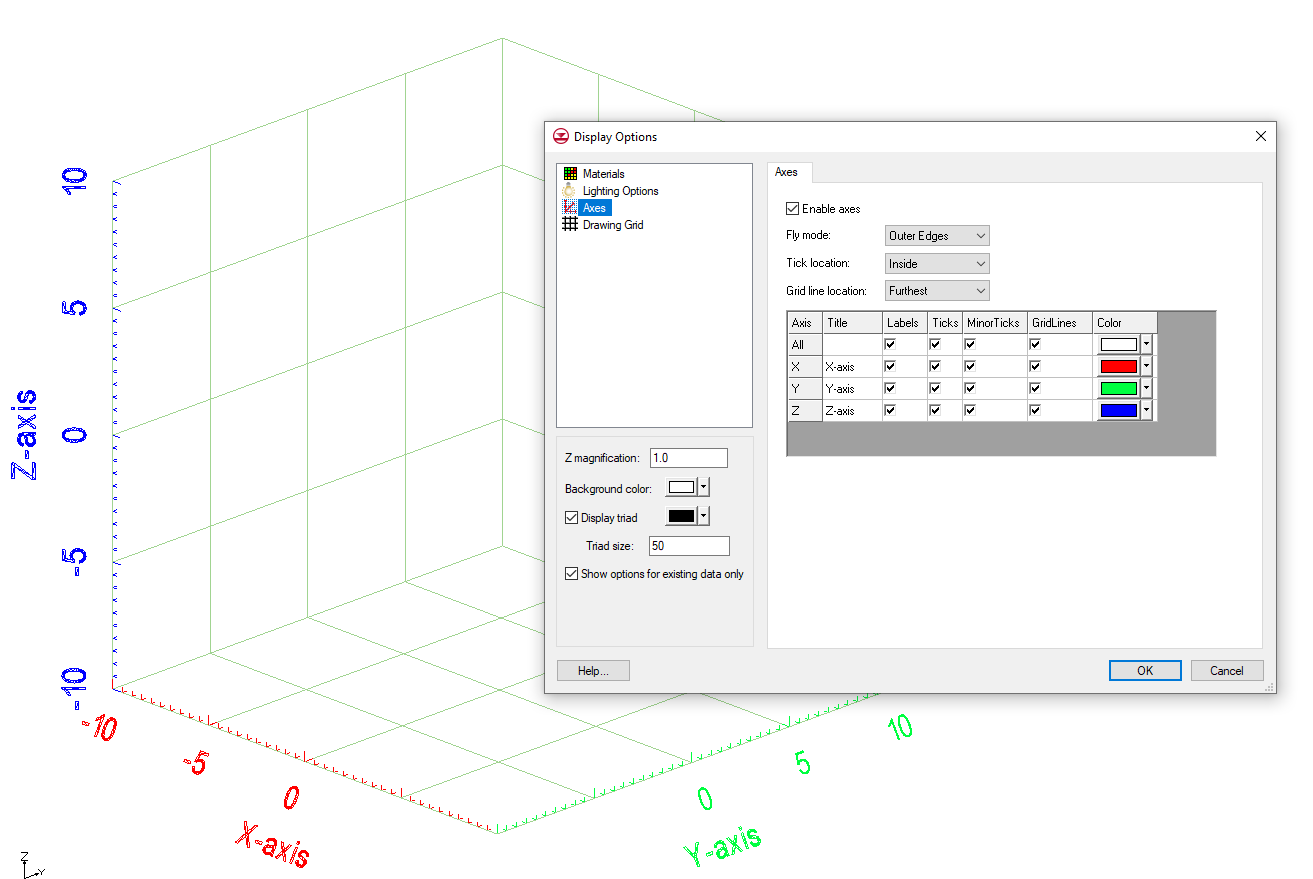
Example of the Axes Display Options

The Axes display options allow you to control the different aspects of the axes display, such as:

  • Fly modes to set where in space the axes will be placed.
  • Tick location options to set which direction tick lines along the axes will be drawn pointing to, either inward or outward.
  • Grid line location options to set which surfaces grid lines are actually drawn on, which can help in visualizing the grid.
  • A spreadsheet containing options for editing each individual axis, as well as a row for editing all of them at once.

Try out experimenting with Axes display options in GMS 10.5 today!

Blog tags: 

Pages