Creating Water Levels in AHGW
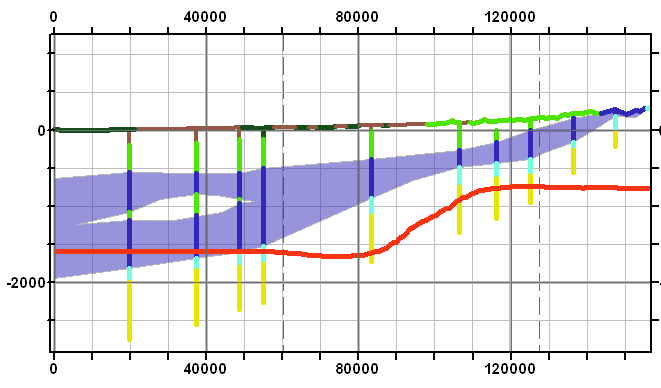
By aquaveo on March 31, 2021When using Arc Hydro Groundwater (AHGW) with ArcMaps, you can create a line that represents a water level, or other structures in your cross section 2D plots. This article will discuss some of the ways to do this.

If the data is available as a raster surface of water level data, you first call the "Create XS2D Line Feature Class" tool to set up a line feature class for holding the data. Then you will run the Transform Raster to XS2D Line tool, which will insert the line feature for the raster elevation levels that intersect the cross section.
If a raster is not available, you can create a water surface line, but a little more work will be involved.
First, run the Create XS2D Line Feature Class tool once you have the basic cross section set up, to hold the water level line.
Next, you'll have to do one of the following:
- If you have a general idea of the water level, enter the water level line manually. Manually draw in the water level line, using the Create Features tools built into ArcMap to create polyline features. This is all manually done, and may not match the more detailed data you might have.
- If you have an image or drawing of the water level for the cross section you're working on, you can insert it behind the XS2D cross section in a way that will match the size and scaling of the cross section. While it is typically used for existing diagrams of cross sections, it could also be used to show the water levels if you happen to have such an image.
- If you have the water level data as points, you could also add them to an XS2D cross section. This takes point and/or line features with XYZ data and transforms them onto the XS2D cross section. Points at the ground location are used to project onto the XS2D Cross Section, and are given an elevation value based off of a ground elevation raster, not a water level. But, if the water level data is sparse, adjust the values of the water level points to known values (manually), and then follow the first suggestion (manually drawing a line) but snapping the line on these imported points.
- Finally, if you have water elevation values at known distances along the line, you could simply import them via a spreadsheet, using the guidelines below:
- The X value in the XS2D data frame is the distance along the SectionLine feature used to create the XS2D data frame. So if a section line is 1000m long, X=0m is for the start, and X=1000m is for the end. You could automatically calculate this distance if you don't have it by running the Add XY Coordinates (Data Management) tool to get the X values in the attribute table, and then copy them to a spreadsheet.
- The Y values in the XS2D data frame are simply real-world elevation values, multiplied by the Vertical Exaggeration value of the XS2D data frame. For example, if you have a water level of -100m, and a vertical exaggeration of 20, then it will be plotted in the XS2D data frame with a Y value of -2000 (-100 * 20).
- After getting the X values (distance along the curve), you could simply calculate the Y values as well. If you have depth values, be sure to convert the water levels to elevations, and once you have elevations, multiply by the vertical exaggeration.
- Then, run the Add XY Data tool in ArcMap. Put the points into an XS2D point layer, and add it to the XS2D cross section data frame. Then make an XS2D line feature class (as mentioned above), and use the create polyline tools to sketch out the water levels (as mentioned above) - basically connecting the dots. When making the line features, make sure that they snap to the points you just created.
Try using AHGW to create water levels or other structures in ArcMap today!


