Exporting Transient Observation Data
When working with transient data in the Groundwater Modeling System (GMS), having a way to view the generated Plot Wizard. The Plot Wizard is found under the Display menu at the top of the GMS window. The Plot Wizard opens to a dialog containing a list of all the available plot types. If you're not sure which plot type will contain the data you're looking for, a short description of the selected plot will appear on the right under the plot preview.
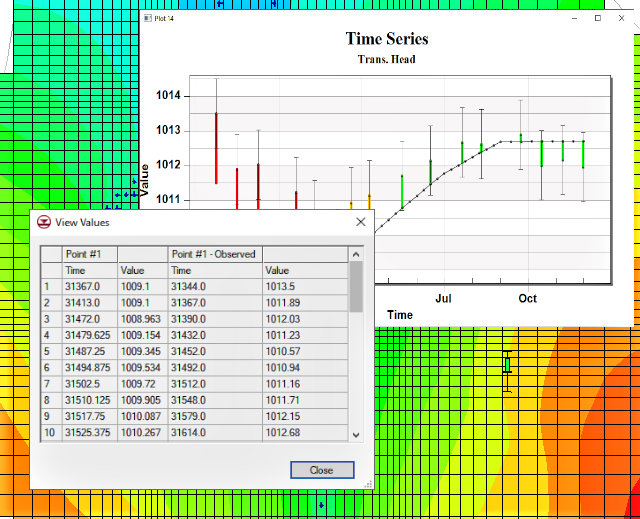
Once you finish the set up in the Plot Wizard and the plot is generated, you can right-click on the plot window and select "View Values" to bring up the View Values dialog. This dialog contains a simple data table which includes a list of all points and observed points, as well as a list of all time steps and their related value.

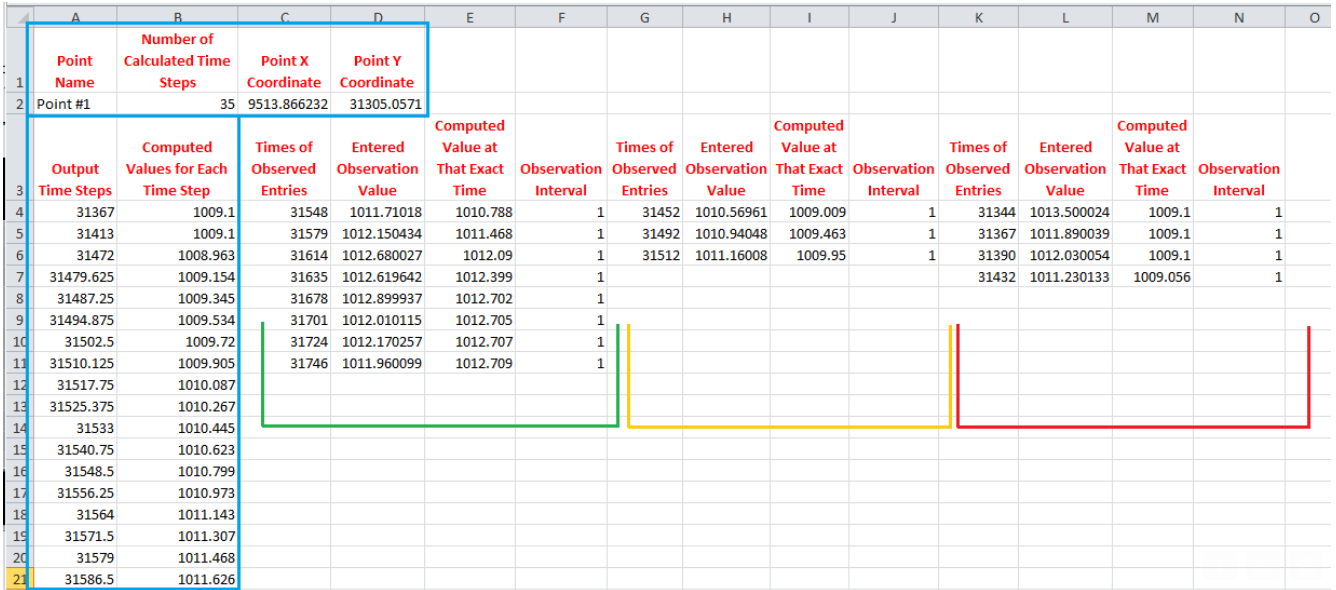
The second method to view observation data is by going to the MODFLOW menu at the top of the window and selecting Observations. This method opens a window which will allow you to export a CSV file that contains all the observation data. Make sure that "Use" is turned on for the Observation Wells coverage, and then click "Export Trans. Obs…" to bring up the Transient Observation Filename dialog. Although the "Save as type" dropdown may indicate that the data can only be exported as a TXT file, it will actually save as a CSV file. The CSV file contains a more comprehensive table of all the observation data than the Plot Wizard does.

The given data for the exported observation data is divided into several groups. Each group contains a list of observation times, the corresponding recorded value, and the computed value at those specific times. This is sometimes different from the output times from the calculated list, so it offers precise values for comparison, removing the need for estimation based on the output list.
Head over to GMS and check out how this can improve how you view transient data today!


