Viewing a 3D Bridge in a Plot
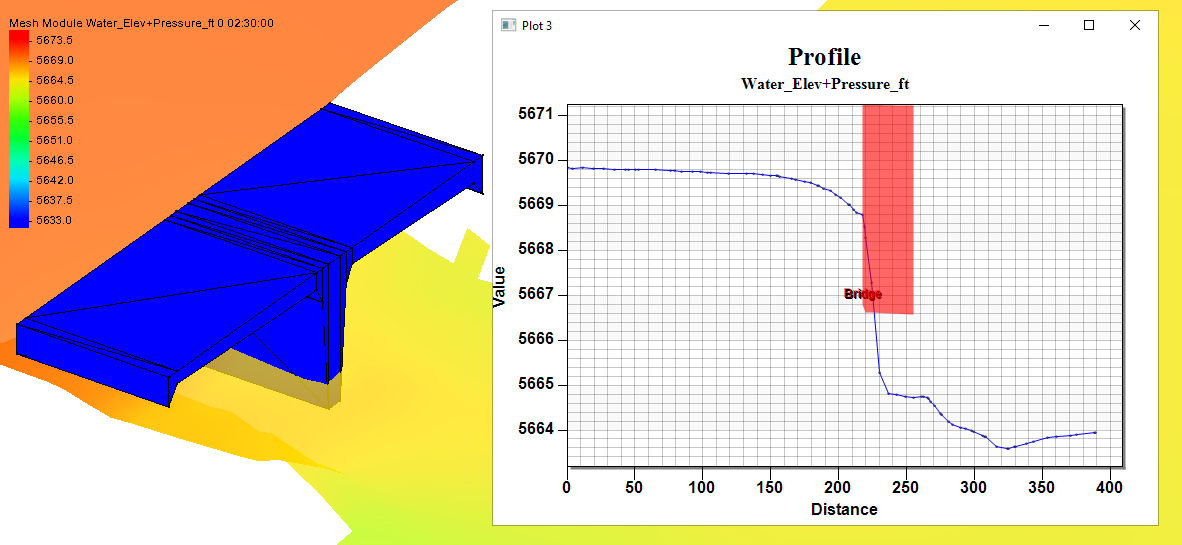
Have you had difficulty determining where in your plots your 3D bridges are located? At times it can be challenging to determine where objects lie along a generated line plot. This is why SMS has the functionality to be able to tell the plot to display the location of a 3D Bridge. This post will review how to view the location of a 3D bridge in a plot.

The Plot Data coverage provides the ability to locate structures on a profile plot, which could be used to map the location of a 3D Bridge. However, SMS also allows using the Bridge coverage to help see where the 3D bridge is located on the profile plot. It is important to note that a 3D bridge defined within a 3D Bridge coverage will have to be used, as a UGrid will not suffice.
Once you have all your 3D bridges created and defined, you will need to make a profile plot. This is done by using an observation arc within an Observation coverage that intersects the 3D bridge so that it will eventually be visible in the plot. Select that observation arc, and then right-clicking the arc, you must select the Show Observation Plot command to open a Plot window. This plot will automatically update based on which of the datasets and time steps are selected. This plot shows the data values along the observation arc, but by default does not show where a 3D bridge or other structures intersect with the observation arc.
After the profile plot has been generated, right-click within the Plot window and select the Plot Data command to bring up the Data Options dialog. Notice the options in the Components section related to the 3D bridge coverage. Turn on the check boxes for the 3D bridge coverage in any of the relevant rows.
When everything has been set up correctly, the plot will have properly updated itself and you will be able to see a representation of the selected 3D bridges within the Plot window at this point. Now you will be able to properly keep track of where your 3D bridges come into contact with your profile plots.
Try out viewing 3D bridges in a plot in SMS 13.1 today!


