We use cookies to make your experience better. To comply with the new e-Privacy directive, we need to ask for your consent to set the cookies. Learn more.

Diagnosing Costly Model Stability Issues with SMS
Model stability is one of the most important aspects of hydraulic simulation quality. Even if a model successfully runs to completion, numerical instability can produce unrealistic velocities, fluctuating water surfaces, or unreliable flood extents. Fortunately, the Surface-water Modeling System (SMS) provides several visualization and plotting tools that help users identify and diagnose stability issues in models such as SRH-2D, ADCIRC, and CMS-Flow.
Learning how to recognize instability patterns in SMS results can save significant troubleshooting time and improve model accuracy.
What Causes Model Stability Issues?
Stability problems often result from:
-
Time steps that are too large
-
Poor mesh quality
-
Abrupt elevation changes
-
Unrealistic boundary conditions
-
Sudden hydrograph spikes
-
Extremely shallow or rapidly changing flow depths
These issues may not always generate explicit solver errors, making visual inspection of results an essential part of quality control.
Recognizing Oscillations in SMS Animations
One of the easiest ways to detect instability is by animating model results in SMS. Using the Time Steps toolbar and animation controls, users can visualize changing datasets such as:
-
Water surface elevation
-
Flood depth
-
Velocity magnitude
-
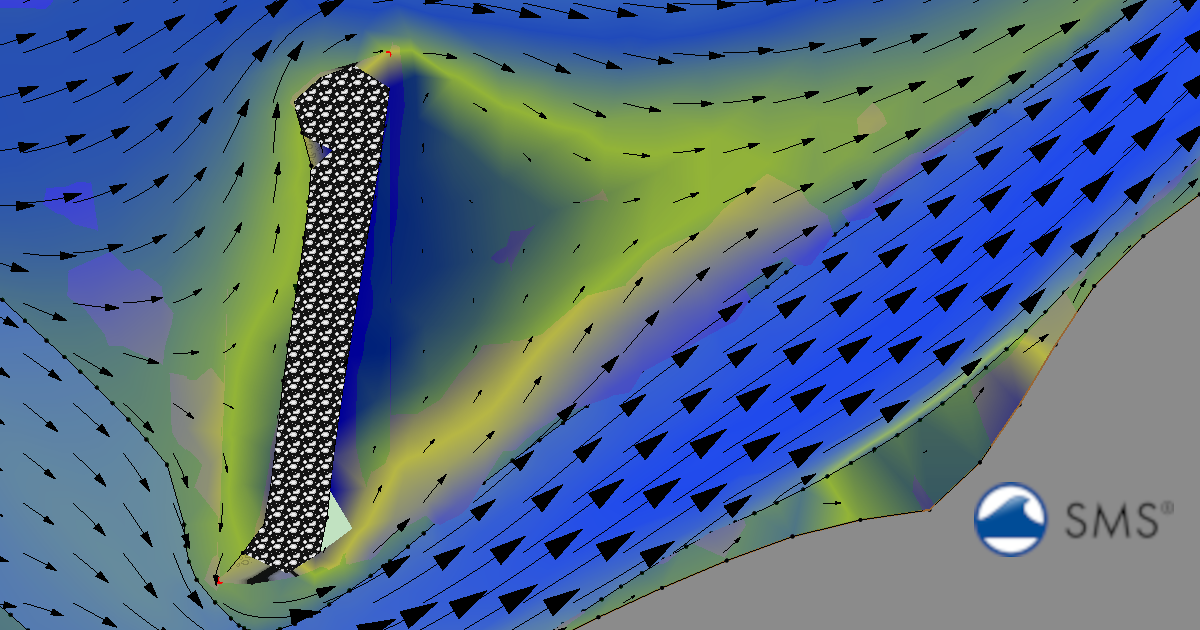
Velocity vectors
Signs of Numerical Oscillation
Oscillations often appear as:
-
Water surfaces rapidly rising and falling between time steps
-
Velocity vectors abruptly changing direction
-
Checkerboard-style contour patterns
-
Flickering wetting and drying regions
In stable simulations, flow transitions should appear smooth and physically realistic. Sudden jumps or repeated fluctuations are often warning signs of instability.
Using Plots to Detect Time Step Problems
SMS plotting tools are especially useful for diagnosing timestep-related issues. Observation points and monitoring arcs can be used to generate hydrographs and time-series plots.
Common Stability Indicators in Plots
Unstable models may show:
-
Sharp sawtooth patterns in stage plots
-
Rapid oscillations in discharge values
-
Unrealistic spikes in velocity
-
Water surface elevations fluctuating without physical cause
These artifacts are commonly associated with timesteps that are too large for the mesh resolution or hydraulic conditions.
Evaluating Velocity and Depth Results
Velocity and depth datasets can reveal localized instability areas.
Watch for:
-
Extremely high isolated velocities
-
Sudden depth changes between neighboring cells
-
Dry cells repeatedly turning wet and dry
These patterns often occur near poorly refined geometry, abrupt mesh transitions, or improperly assigned boundary conditions.
Best Practices for Improving Stability
When instability appears in SMS results, consider:
-
Reducing the simulation timestep
-
Refining the mesh near hydraulic structures or steep gradients
-
Smoothing abrupt terrain transitions
-
Redistributing vertices along critical arcs
-
Checking inflow and outflow boundary condition values
-
Reviewing wetting and drying settings
Visualization should always be part of the model review process—not just the final presentation stage.
Conclusion
SMS provides powerful visualization and plotting tools that help modelers identify numerical instability before results are used for design or decision-making. By carefully reviewing animations, contours, vectors, and time-series plots, users can recognize oscillations and timestep issues early and build more reliable hydraulic models.
Download the latest version of SMS today!
June 9, 2026
|
View: 630
|
Categories: SMS
|
By: <a class="mp-info" href="https://aquaveo.com/blog/author/admin">Aquaveo Staff</a>
About the Author

Performing a Silent Install of XMS (Passwords & Hardware Locks)
October 10, 2018
Converting a NET File to an INP File
May 9, 2018
Computing Basin Curve Numbers in 9 Easy Steps
May 16, 2023
Performing a Silent Install for ALS
October 27, 2021
Tips for Finding Information on the XMS Wiki
September 25, 2019
Tips for Using Wells with MODFLOW 6
July 14, 2026
Enhanced Arc Geometry and Vertex Tools
July 7, 2026
SRH-2D Inflow & Outflow Best Practices
June 30, 2026
Troubleshooting Projection and Coordinate System Issues
June 23, 2026