We use cookies to make your experience better. To comply with the new e-Privacy directive, we need to ask for your consent to set the cookies. Learn more.

Animating and Comparing Model Output
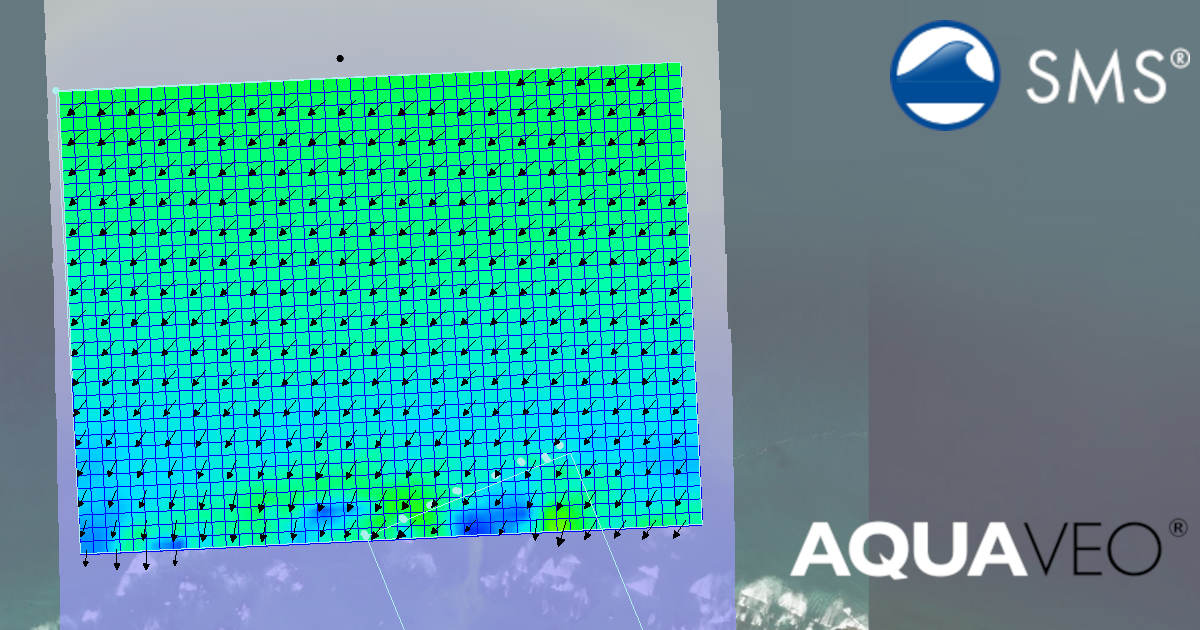
Once a hydraulic model is complete, the next step is understanding what the results mean. In the Surface-water Modeling System (SMS), visualizing model results through animations is one of the most effective ways to interpret and compare time-dependent changes in velocity, flood depth, and water surface elevation. Animations help modelers see flow patterns evolve and compare different simulations to better understand system behavior.
Why Animate Model Results?
Static snapshots tell only part of the story. Animations allow you to observe:
-
How velocity vectors change direction and magnitude over time
-
The rise and fall of flood depths during storm events
-
Shifts in water surface elevation throughout a simulation
These visualizations are especially useful for identifying problem areas such as flow constrictions, overtopping, or unstable regions in your model domain. The makes it easier to communicate results to stakeholders or project partners.
Creating Animations in SMS
-
Load Time Series Results
After running a model such as SRH-2D or ADCIRC, import the results into SMS. Time-dependent datasets (e.g., water surface elevation, velocity, depth) appear in the Project Explorer. -
Display Options
Use the Display Options dialog to adjust visualization:-
Contours for water surface elevation or depth
-
Vectors for velocity magnitude and direction
-
Water surface animation for inundation visualization
-
-
Create the Animation
Use the Data > Film Loop command to start the Film Loop Wizard. Using the wizard you can set the film loop type, film play rate, and additional display options.
-
Export the Animation
Once satisfied, export the sequence as a video file or image series for presentations, reports, or side-by-side comparison.
Comparing Multiple Simulations
To compare two model runs (e.g., baseline vs. design alternative):
-
Load both results sets into SMS
-
Use the Data Calculator or Compare Datasets tool to compute changes in velocity or depth
-
Animate the difference dataset to visualize how a design modification affects hydraulic behavior
Conclusion
Animations in SMS transform time-series data into clear, intuitive insights. Whether analyzing velocity vectors, flood depths, or surface elevations, time-based visualizations make it easier to detect trends, validate model stability, and communicate findings effectively. Make your own animations and comparisons for your project by downloading SMS today!
December 2, 2025
|
View: 1306
|
Categories: SMS
|
By: <a class="mp-info" href="https://aquaveo.com/blog/author/admin">Aquaveo Staff</a>
About the Author

Performing a Silent Install of XMS (Passwords & Hardware Locks)
October 10, 2018
Computing Basin Curve Numbers in 9 Easy Steps
May 16, 2023
Converting a NET File to an INP File
May 9, 2018
Performing a Silent Install for ALS
October 27, 2021
Tips for Finding Information on the XMS Wiki
September 25, 2019
Tips for Modeling Bridge Scour
May 19, 2026
Essential Guide to WMS Rain-on-Grid Modeling
May 5, 2026
Best Practices for Modeling Complex Geometries
April 28, 2026
Managing MODFLOW 6 Data: Lists, Copy Period & CSVs
April 21, 2026