We use cookies to make your experience better. To comply with the new e-Privacy directive, we need to ask for your consent to set the cookies. Learn more.

Utilizing Contour Legends
The Groundwater Modeling System (GMS) contains many tools for visualizing data. The contour visualization tools are particularly helpful in viewing solution data. With contours, GMS provides several options for how contours will be displayed, including options for the contour legend. When a legend is added to the contour display, it is not always clear what the units of the values shown in the legend are. With GMS 10.8 improvement to the Contour Legend Options allow displaying the data units with the legend.
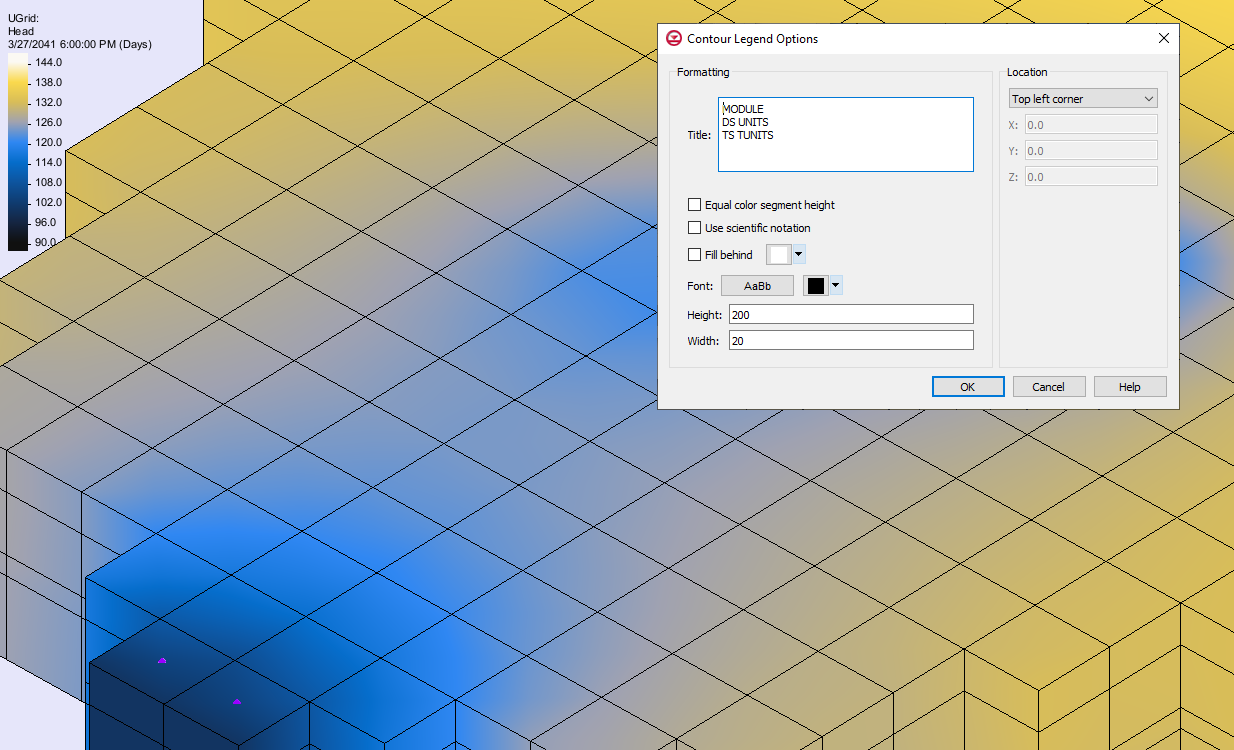
The Contour Legend Options dialog is available for the contour dataset displayed in the Graphics Window. Accessed from the Legend Options button on the Contour Options dialog, the Contour Legend Options dialog controls the formatting and location of a displayed legend. The tool is only available if the Legend check box on the Contour Display Options Dialog is checked. This dialog includes formatting options such as a title field, a font selection button, as well as fields for height and width. Furthermore, the dialog offers location options that includes a combo box for specifying the location of the displayed legend. Visit our wiki page to view descriptions of each feature this dialog provides.
Here is a step-by-step of how to execute this feature:
- Select Contour Options.
- At the bottom of the Dataset Contour Options dialog, ensure that the Legend option is checked.
- Select Options in the Legend section.
- In the Formatting Section of the Contour Legend Options dialog, enter the respective unit keyword: "UNITS" for DS (Datasets) and "TUNITS" for (Time steps).
The ability to add the unit type to the legend is a user requested feature that helps make presenting data clearer for your audience. This and other improvements are continuously being added to GMS. Head over to GMS and check out the options for legend displays and other features.
August 20, 2024
|
View: 493
|
Categories: GMS
|
By: <a class="mp-info" href="https://aquaveo.com/blog/author/admin">Aquaveo Staff</a>
About the Author

Performing a Silent Install of XMS (Passwords & Hardware Locks)
October 10, 2018
Tips for Finding Information on the XMS Wiki
September 25, 2019
Aquaveo 2024 in Review
December 30, 2024
Help with Flow Direction and Accumulation
December 17, 2024
New Tool for Locked Nodes Datasets
December 13, 2024
Enhanced Structure Options for CMS-Flow
April 8, 2025
Employing Hydraulic Conductivity in MODFLOW 6
April 1, 2025
Applying Hard Bottom Data to Your CMS Simulations
March 25, 2025
Optimizing the Graphics Window in SMS 13.4
March 18, 2025
Troubleshooting Well Exclusions in MODFLOW
March 11, 2025