We use cookies to make your experience better. To comply with the new e-Privacy directive, we need to ask for your consent to set the cookies. Learn more.

Using Contours to View Contaminant Flow into a Well
You’ve finished creating a model tracking the contaminant flow into a well. Your values look good and you’re certain the model executed successfully. The only problem is that when you look at you model, the visual representation of the contaminant flow is rather lackluster. You can tell there is flow towards the well, but it’s hard to clearly see how much of the contaminant is entering. Knowing this information can sometimes make a significant difference.
The solution to this dilemma is to adjust your contour options. In particular, two options will help you see the contaminant flow more clearly: adjusting the contour interval and adjusting the contour range.
Contour Intervals
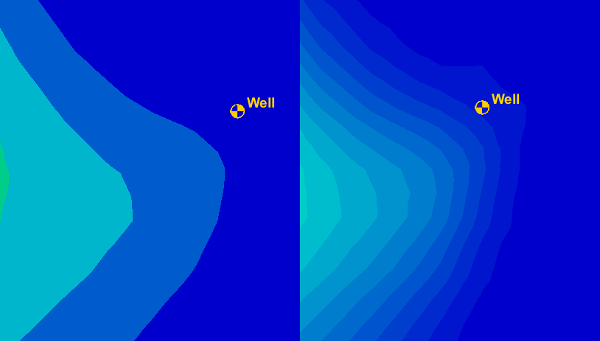
When looking at your contaminant flow, it might appear as though the contaminant has not reached your well. This can be misleading if looking at the model zoomed in and with a small contour interval. Smaller amounts of the contaminant might have reached the well, but we wouldn’t know because the interval is too small to show that level of detail.
After turning on contours for the solution set, increase the intervals around the well by doing the following.
- Zoom in on the well area.
- Make the contaminant dataset active in the Project Explorer.
- Click the Contour Options macro.
- In the Dataset Contour Options dialog, increase the contour interval value.
Now the contour has been broken up into more intervals, making it easier to see when the contaminant first reaches the well.
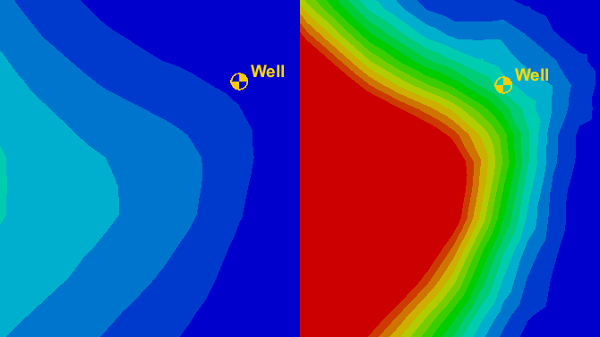
Contour Ranges
Another option is to change the contour range so it targets the values near the well. After turning on contours for the solution set, change the range by doing the following.
- Zoom in on the well area.
- Make the contaminant dataset active in the Project Explorer.
- Click the Contour Options macro.
- Turn on the Specify a range option.
- Enter minimum and maximum range values that focus on those contour values near the well.
Now the contours specifically highlight the contaminant flow into the well.
By experimenting with the different contour options, you can find the one that best shows contaminant flow in your project. Try this today in GMS!
June 20, 2018
|
View: 262
|
Categories: GMS
|
By: <a class="mp-info" href="https://aquaveo.com/blog/author/admin">Aquaveo Staff</a>
About the Author

Performing a Silent Install of XMS (Passwords & Hardware Locks)
October 10, 2018
Tips for Finding Information on the XMS Wiki
September 25, 2019
Aquaveo 2024 in Review
December 30, 2024
How to Fix MODFLOW General Head Boundary Errors Using GMS
February 18, 2025
Help with Flow Direction and Accumulation
December 17, 2024
Connecting UGrid Points with Arcs
May 6, 2025
Simplifying Nested Grids with the Spectral Coverage
April 29, 2025
Converting Solids to Scatter Sets in GMS
April 22, 2025
Simplifying Watershed Modeling with Rho8 Tools
April 15, 2025
Enhanced Structure Options for CMS-Flow
April 8, 2025