We use cookies to make your experience better. To comply with the new e-Privacy directive, we need to ask for your consent to set the cookies. Learn more.

Storing Time Series Data Using the Spatial Data Coverage
Tired of hunting through a dozen spreadsheets just to find one elevation trend? We’ve all been there—emailing a project file to a colleague, only to realize you forgot to attach the "Data_Final_v3_USE_THIS.csv" file. The good news? In Aquaveo’s Surface-water Modeling System (SMS) time series data does not have to live outside your project.
There’s a smarter, cleaner, and more reliable way to manage time series data directly inside SMS projects. Once you start doing this, you’ll wonder why you ever worked any other way.
Why Store Time Series Data Inside Aquaveo SMS?
Traditionally, time series data—like water surface elevations, flows, or velocities—lives in separate files. That approach works… until it doesn’t. Files get renamed, moved, or forgotten. Links break. Colleagues get confused.
Using Spatial Data coverages in Aquaveo SMS, you can store time series data inside the project file and attach it directly to map locations. When you share the SMS project, all the data travels with it. No missing files. No guesswork.
This method improves data integrity, speeds up collaboration, and makes your project easier to understand—especially months later when you reopen it.
Step 1: Create a Spatial Data Coverage in SMS
Start by giving your time series data a proper home:
1. Right-click Map Data and create a new coverage.
2. Choose Generic | Spatial Data as the coverage type.
3. Name it something descriptive like “Stream_Gage_TimeSeries”.
Clear naming helps your entire team instantly understand what the data represents.
Step 2: Place a Feature Point Where Data Was Collected
Next, use the Create Feature Point Tool to add a point to the map. When possible, place it at the real-world location of the measurement—such as a gage station, culvert, or bridge.
This spatial connection makes your SMS project more intuitive and professional. Anyone opening the project can immediately see where the data applies.
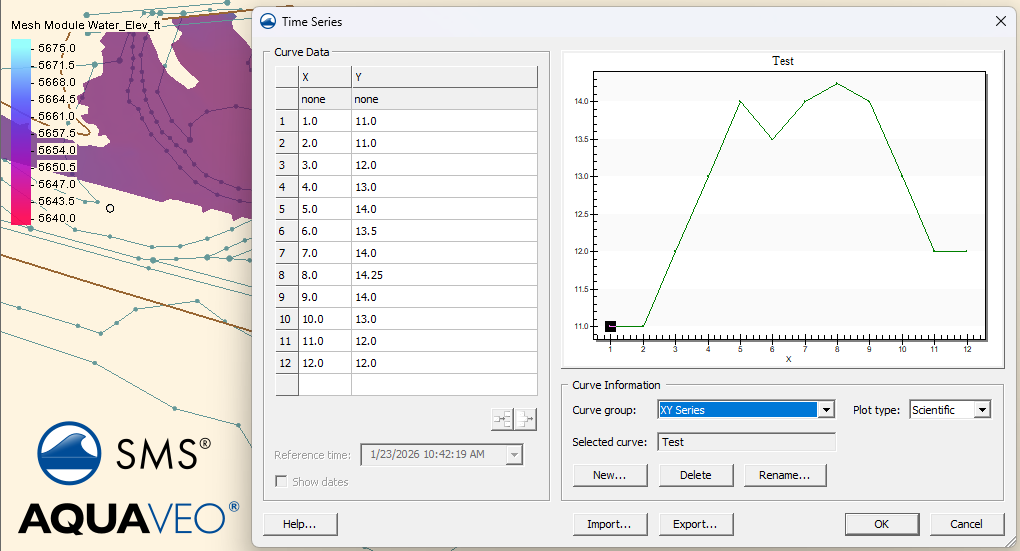
Step 3: Attach Time Series Data to the Point
1. Select the feature point, right-click, and choose Add | Time Series.
2. In the Curve Group, specify the data type (Elevation, Flow, Velocity, etc.).
3. Click New, name your curve something descriptive, and open the editor.
You’ve now created a built-in time series tied directly to your model.
Step 4: Import Your Data
Values can be manually added. For larger datasets, use the Import button to bring in data from a file or paste directly from Excel. Need to update it later? Just right-click the point and edit the time series instantly.
Conclusion
Centralizing time series data within an Aquaveo SMS project offers a direct way to manage information.
Keeping time series data inside Aquaveo SMS projects saves time, reduces errors, and makes collaboration painless. It delivers benefits that can be seen with long-term or multi-user projects. Make use of the spatial data coverage in SMS today!
February 24, 2026
|
View: 1242
|
Categories: SMS
|
By: <a class="mp-info" href="https://aquaveo.com/blog/author/admin">Aquaveo Staff</a>
About the Author

Performing a Silent Install of XMS (Passwords & Hardware Locks)
October 10, 2018
Converting a NET File to an INP File
May 9, 2018
Computing Basin Curve Numbers in 9 Easy Steps
May 16, 2023
Performing a Silent Install for ALS
October 27, 2021
Tips for Finding Information on the XMS Wiki
September 25, 2019
Tips for Using Wells with MODFLOW 6
July 14, 2026
Enhanced Arc Geometry and Vertex Tools
July 7, 2026
SRH-2D Inflow & Outflow Best Practices
June 30, 2026
Troubleshooting Projection and Coordinate System Issues
June 23, 2026