We use cookies to make your experience better. To comply with the new e-Privacy directive, we need to ask for your consent to set the cookies. Learn more.
Drogue Plots: A Versatile Animation Tool
For some Surface-water Modeling Systems (SMS) projects, you may want to know the likely path of water flow, as well as how fast and how far a flow pattern can carry a particle. Between the Display Options dialog and the animation options available in the Film Loop option of the Data menu, SMS has many choices for visualizing these effects once a simulation has been run. If knowing how long a particle may remain in a basin or other region, or how fast it may travel is important to your project, the Drogue Plot option in the Film Loop dialog is a great option.
Drogue plots are used for post-processing visualization in the animation application for all surface water models. The particles simulated are massless objects or “drogues” floating in the flow field. SMS computes the paths these particles would follow when driven by the currents of the flow field.

Unlike Flow Trace animations, where particles are shown starting in random locations, Drogue Plots use feature points, arc nodes and vertices to specify a start location for each particle/drogue. It will then follow each particle through to the end of the specified time frame or until the particle permanently leaves the model area. You must define a Drogue Plot coverage before selecting the Drogue option when setting up a film loop. Part of the coverage defines the starting location per particle.
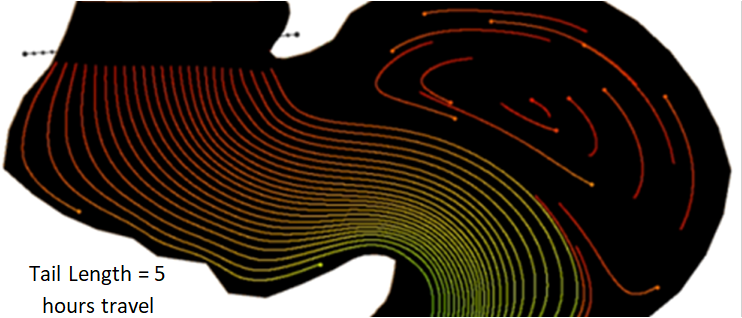
The Drogue Plot will always trace a colored trail on a black model domain background. The animation may show the particles in color based on whether you choose to set it for the current velocity of the particle or for the distance traveled. You can specify the length of the tail based on the time traveled. The longer the tail, the faster the particle is moving. All of these options can be tailored to your project’s needs.
If you select the “Write Report” option, a data file will be created containing statistical information on each particle or drogue with the information you choose to include. It can contain any or all of the following: start and end locations in x and y coordinates, distance traveled, and the maximum, minimum, and average velocities traveled during the animation time frame. If the drogue leaves the domain, the ending location will be the spot where it exited.
The animations can be saved as AVI or MP4 files.
With both the animation and the statistical reports, Drogue Plots could give you what you need for your project. Head on over to SMS and see what the Drogue Plots animation can do for you.


