We use cookies to make your experience better. To comply with the new e-Privacy directive, we need to ask for your consent to set the cookies. Learn more.
Utilizing MODFLOW Symbols Display Options
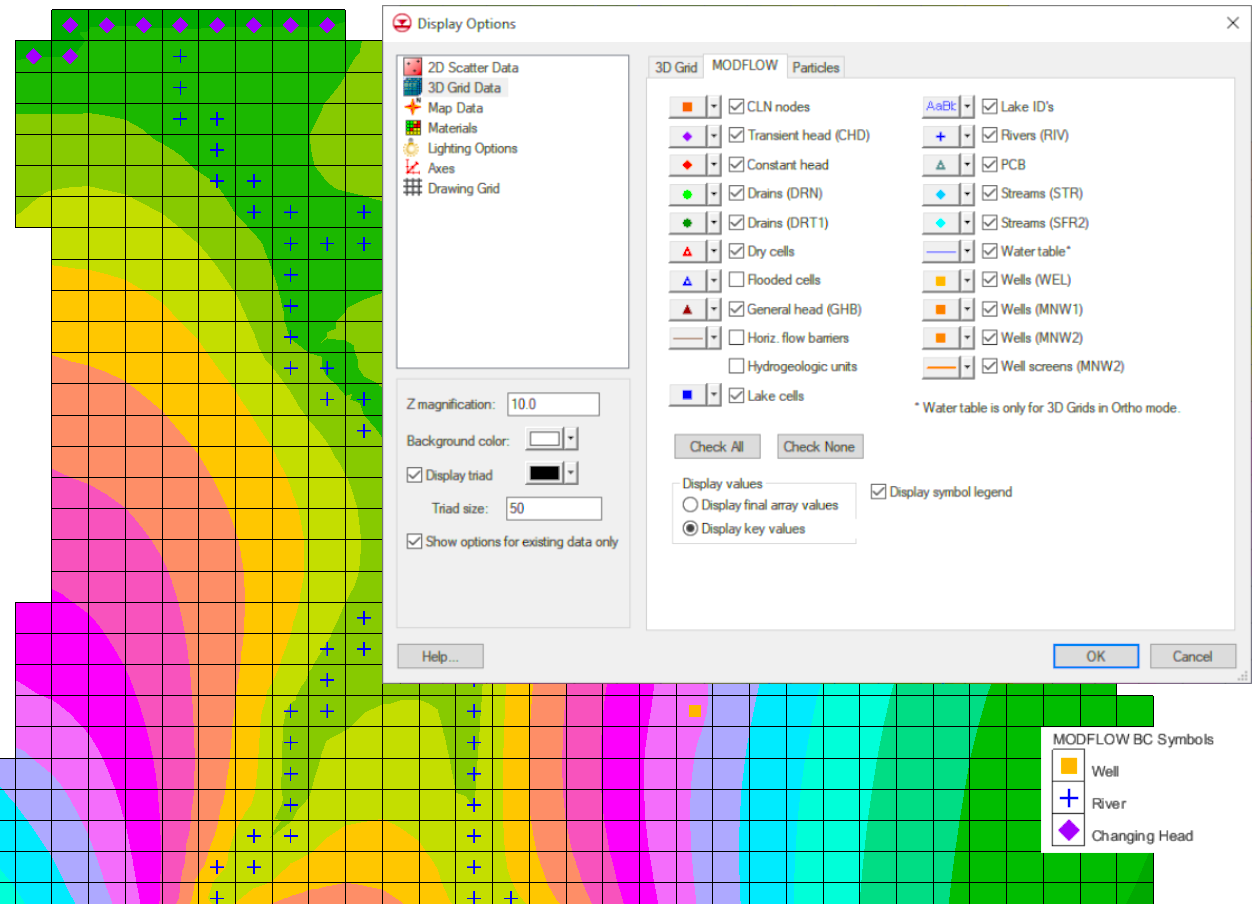
The Groundwater Modeling System (GMS) has many different options for customizing the display of your project. One display feature created for MODFLOW in GMS is the ability to use symbols to represent the properties of individual cells. This can be quite useful especially for more complicated MODFLOW models. You can use the MODFLOW symbols in the Display Options dialog to represent things like rivers, lakes, wells, drains, and more.

You can find the MODFLOW display options as their own tab by selecting the corresponding grid from the list on the left side of the Display Options dialog. The MODFLOW symbols all have a default shape, size, and color. The shape, size, and color of the symbols can all be customized by clicking the button to the left of the checkbox. The ability to customize the MODFLOW symbols is a useful feature for everyone, but especially our users who are visually impaired or color blind. For the best results, the symbols should be set to something different enough from each other that it is easy to tell which is which at a glance.
If you use the MODFLOW symbols in your project, you should consider turning on the display symbol legend. The legend shows a list in the corner of the Graphics Window of all of the MODFLOW cell properties contained within the current project, making it easier to keep track of what everything means. Only symbols that exist in the layer being viewed will appear in the legend.
There are a few additional symbol display options for MODFLOW on the Map Data section of the Display Options dialog. A list of the symbols appears when MODFLOW is selected from the Coverage dropdown. These symbols are specific to properties on the coverages in your project, and they can be customized in the same way as the symbols under the MODFLOW tab of the grid in the Display Options dialog.
Open GMS and use the MODFLOW symbols in the display options to help you keep track of the properties of your MODFLOW project today!


