We use cookies to make your experience better. To comply with the new e-Privacy directive, we need to ask for your consent to set the cookies. Learn more.
Using the Equal Color Segment Height Legend Option
Have you wanted the legend to better represent the scale of your contours in your GMS projects, especially if your intervals are logarithmic? Having a well-configured legend can be very helpful in interpreting the contours of your project in the Graphics Window. And a logarithmic scale for your legend can be useful when you have wide-ranging values in your model that you want to represent in a compact and nuanced way. This post will review how to modify your contour legend options and how your legend is scaled.
To access the GMS Contour Legend Options:
- First, contour options can be accessed either through relevant parts of the Display Options dialog (accessed from the Display Options macro) or through clicking on the Contour Options macro directly.
- Look to the bottom-left of the dialog and turn on the Legend checkbox.
- Click the Options button to bring up the Contour Legend Options dialog where all the contour legend options will be. This post won’t go into most of these options, but they include such options as setting the legend’s height and width, setting where in the graphics window it will be situated, and customizing its font.

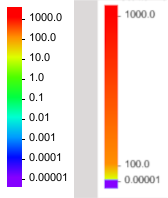
The focus of this post will be the option to turn on Equal Color Segment Height. If the Contour Interval has been set to Number or Specified Interval, this option might not seem so useful, as the values for the contours should already be equally separated. But if the Contour Interval has been set to Specified Values, the Populate Values button will be clickable. This brings up the Value Population Method dialog, where different methods can be used to populate the values of the contours, including a Log Scale Method that will create a logarithmic rather than linear scale to the contours and their legend.
Normally, when a logarithmic scale is used for the contours, the legend will be as well, leading to a lot of the space on the legend being taken up by the higher values and a small amount of space being taken up by the more crowded lower values. Turning on Equal color segment height in the Contour Legend Options dialog can correct this, if that is how you want the legend to be displayed. This option will make the legend display logarithmically, with each logarithmic value displaying equally distant from each other. This means that the legend is no longer a linear gradient, but it better reflects the spread of a logarithmic scale when one is used.
Try experimenting with logarithmic contour intervals and other contour options in GMS 10.5 today!


