We use cookies to make your experience better. To comply with the new e-Privacy directive, we need to ask for your consent to set the cookies. Learn more.
Using the Drawing Grid in GMS
Have you needed to create precise drawing on your map coverage for your groundwater modeling project in GMS? Using the Drawing Grid display options can help with this. This post will review what these are and how they can be used in your GMS project.
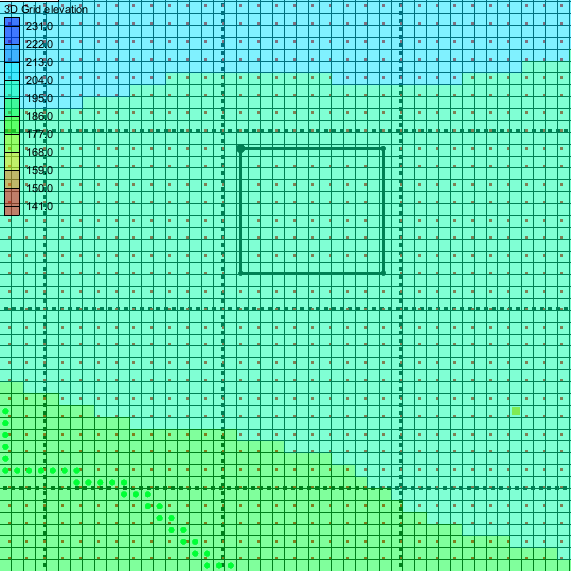
When the drawing grid is turned on, you will have a grid which can be used to reference and measure positions in the project.

To access the GMS Drawing Grid display options:
- Open up the Display Options dialog, either by going to the Display | Display Options command or clicking on the Display Options macro.
- Once the dialog has opened up, select Drawing Grid from the list on the left, and the dialog will populate with the relevant options.
The following is a list of the GMS Drawing Grid display options and what they do.
This Spacing option allows the user to specify by how many units each grid point is separated. This will determine how dense or scattered out the points are, so it is useful to set a value that won’t either be too cluttered or too open.
When the Snap option is selected, all new (not previously existing) vertices, nodes, points, etc., will snap to the nearest grid point when they are being created, or will interactively snap to grid points if they are being dragged. When this is not selected, the drawn grid will have no impact on where they will be placed. Turning this on can be useful when constructing certain features that are meant to conform to the more rigid structure of a grid.
When the Display Grid Lines option is selected, grid lines will be displayed, using the Line spacing increment to determine how many grid points are passed over before another line is drawn. There are also two buttons to the right of this option which will allow the user to customize the look of the lines. Using grid lines can help complement grid points by giving more of a structure to the drawing grid rather than it being just a set of points, especially when the lines are separated at a good distance.
When the Display Grid Points option is selected, grid points will be displayed similar to how the grid lines are displayed, except using the Point spacing increment instead of the Line spacing increment. Grid points not displayed are still functioning as intended within GMS, they just aren’t visible. There are also two buttons to the right of this option which will allow the user to customize the look of the points. Using grid points can help quantify in the Graphics Window where everything is placed and give it orientation, especially when the points are separated at a good distance.
Try experimenting with Drawing Grid display options in GMS 10.5 today!


