We use cookies to make your experience better. To comply with the new e-Privacy directive, we need to ask for your consent to set the cookies. Learn more.

Optimizing SRH-2D Plots in SMS 13.4
When working with SRH-2D simulations, understanding your results is crucial for evaluating your model. An SRH-2D model run will automatically generate multiple solution plots, which are incredibly useful for understanding monitor points or lines, mass balance information, or the percentage of flow entering the simulation. Knowing how to access and effectively use these plots is key to performing a quality check on your simulation.
Viewing the Plots
In the Surface-water Modeling System (SMS), there are a couple ways to view these valuable SRH-2D plots: The first allows you to monitor the quality of your simulation even while it’s still running. This is done through the simulation data available in the Simulation Run Queue dialog. To use this method, the “Monitoring data” option must be turned on within the Simulation Run Queue dialog in order for you to be able to view the plots as they are actively generated.
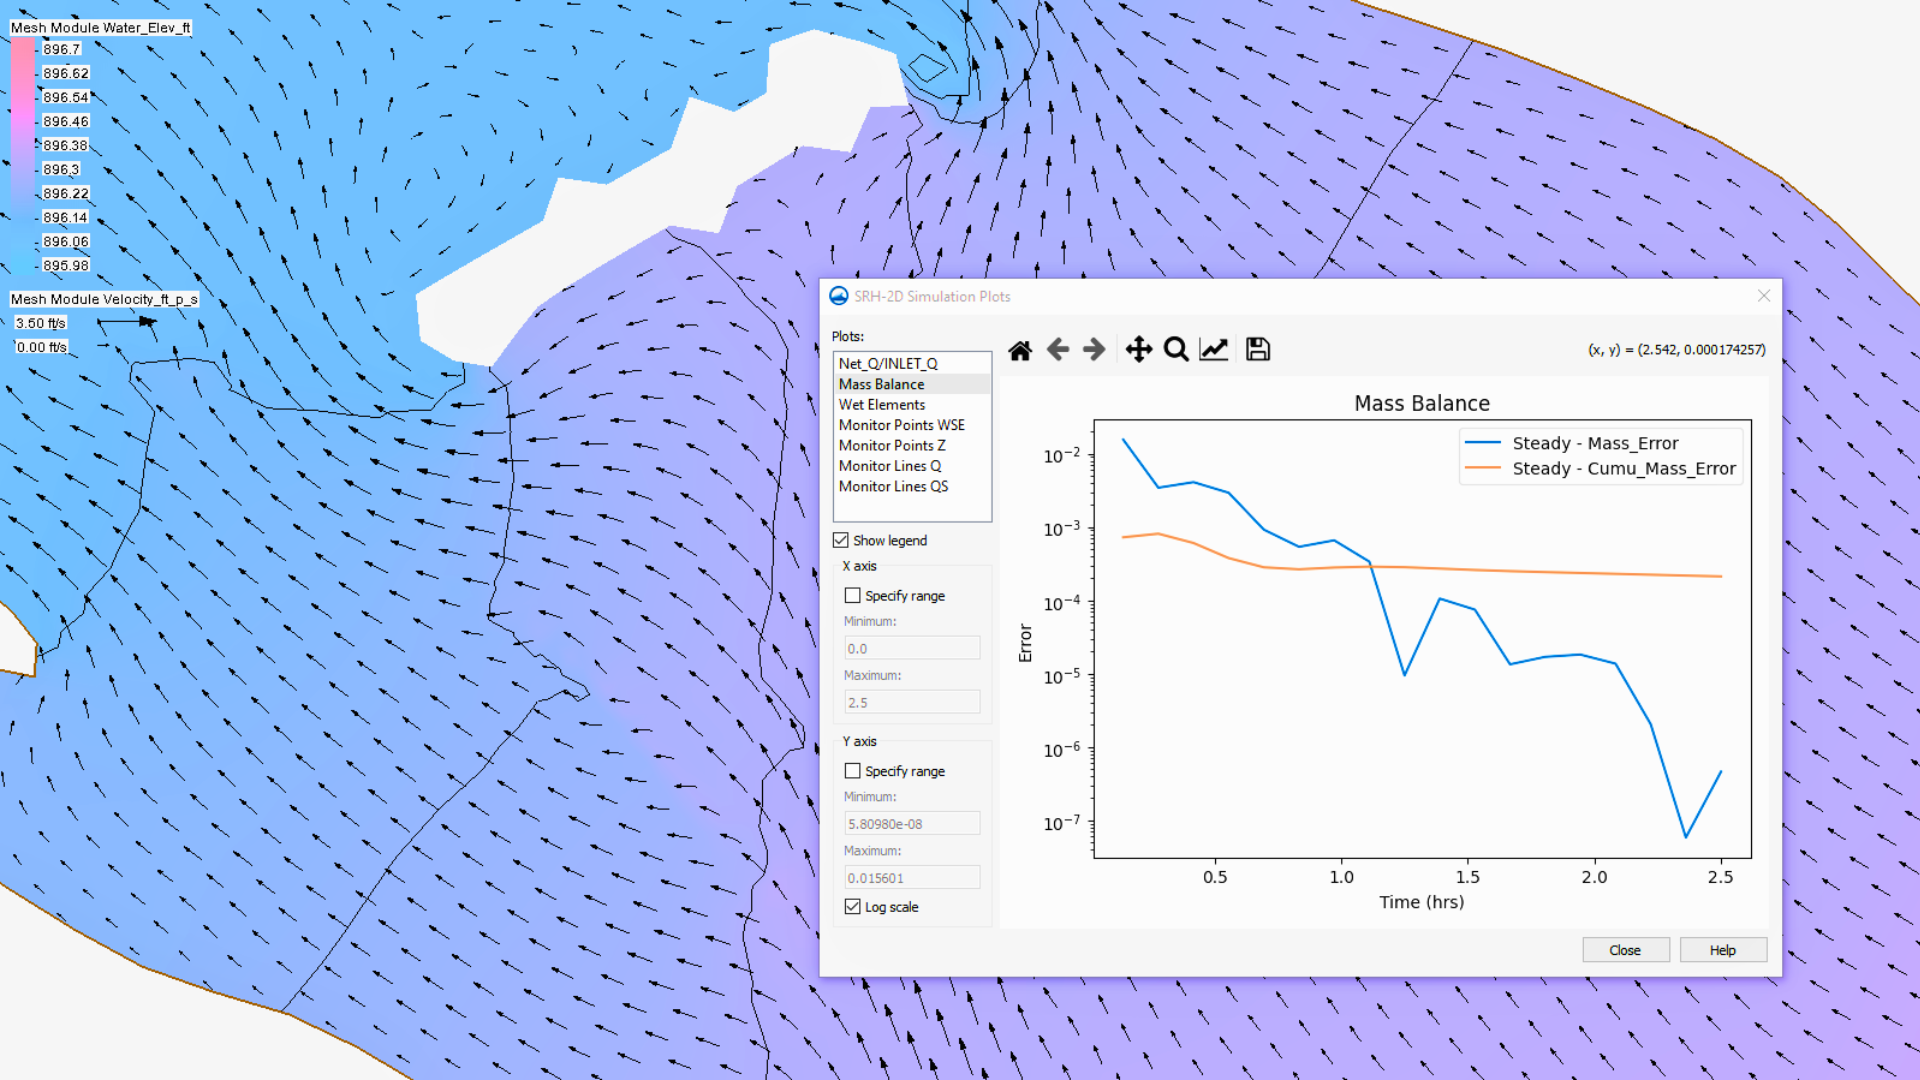
The second method is specifically for reviewing the solution plots after your simulation has successfully completed. This is particularly useful for a post-run quality check and your overall model review. You can access the SRH-2D Simulation Plots dialog by right-clicking on the simulation item in the Project Explorer then selecting Tools | View Simulation Plots.
On the left side of this dialog, there are some various plots to choose from. Below the list of plots, there are some options to further tailor your plots, such as the “Show legend” or the “Specify range” options. Most notably, in the most recent update to SMS, the SRH-2D Simulation Plots dialog has been updated to include the following:
-
An option to display the y-axis using a logarithmic scale
-
A new plot, Qs_tot, to visualize total sediment flux
Included in SMS 13.4, the SRH-2D Simulation Plots dialog also provides several useful tools for navigating and customizing the view of your plot, including:
-
Pan and Zoom
-
Edit Plot Properties
-
Save, Reset View, and navigation between previous and next views
Customizing Your View
The SRH-2D Simulation Plot dialog, with its various viewing options, is a powerful tool within SMS designed to help you visualize and understand what is happening within your surface-water simulation.
-
Real-Time Monitoring: Users can track key metrics like water surface elevation and velocity during a simulation, allowing for quick adjustments if issues arise.
-
Flow Dynamics Visualization: The plots help visualize flow patterns around structures, aiding in the design of structures like bridges, levees, and floodplain assessments.
-
Mass Balance Checks: Quickly assess discrepancies between inflow and outflow, ensuring the physical accuracy of the model.
-
Model Calibration: After simulations, users can refine the model parameters by comparing plots with observed data and adjusting boundary conditions.
-
Post-Run Quality Control: After the simulation completes, the plots help identify anomalies and document findings for future reference.
By leveraging these tools, users can ensure model accuracy, optimize designs, and communicate findings effectively in surface-water modeling projects.
Download SMS 13.4 today to start generating your plots!
May 20, 2025
|
View: 4751
|
Categories: SMS
|
By: <a class="mp-info" href="https://aquaveo.com/blog/author/admin">Aquaveo Staff</a>
About the Author

Performing a Silent Install of XMS (Passwords & Hardware Locks)
October 10, 2018
Converting a NET File to an INP File
May 9, 2018
Computing Basin Curve Numbers in 9 Easy Steps
May 16, 2023
Performing a Silent Install for ALS
October 27, 2021
Tips for Finding Information on the XMS Wiki
September 25, 2019
Tips for Using Wells with MODFLOW 6
July 14, 2026
Enhanced Arc Geometry and Vertex Tools
July 7, 2026
SRH-2D Inflow & Outflow Best Practices
June 30, 2026
Troubleshooting Projection and Coordinate System Issues
June 23, 2026
How to Determine Soil Texture Using NRCS Soil Data
June 16, 2026