We use cookies to make your experience better. To comply with the new e-Privacy directive, we need to ask for your consent to set the cookies. Learn more.

How to Animate Flood Inundation Maps
Communicating flood risk effectively is crucial for those involved in public safety, emergency planning, and infrastructure development. While static flood maps provide valuable information, they often fail to capture how flooding changes over time.
Fortunately, the Surface-water Modeling System (SMS) includes tools to animate flood inundation maps, turning technical simulations into clear, time-based visuals for non-technical audiences.
Why Animate Flood Maps?
Traditional flood maps show only maximum extents, missing key temporal details. SMS animations help demonstrate:
-
Timing—When the flooding begins in specific areas
-
Duration—How the flooding persists
-
Flow direction and speed—How the water moves through the local terrain
-
Infrastructure impact—Which roads or building may be affected
Animations make complex data easier to interpret for public meetings, emergency briefings, or stakeholder presentations.
Creating Flood Animations in SMS
Load Your Model Results
After running a supported model like SRH-2D, TUFLOW, or ADCIRC, open your SMS project. Your results should include datasets that concern water depth, elevation, and velocity. These form the core of your animation. Verify that the model has successfully converged and that flooding can be seen as you go through the time steps.
Visualize the Right Datasets
In the Project Explorer, activate a scalar dataset (e.g., water depth). To show flow direction, activate a vector dataset.
Then go to Display | Display Options…:
-
Enable Contours and apply a color ramp (e.g., blue to red)
-
Use Functional surface for 3D terrain visualization
-
Under the Contours tab, adjust the Transparency (30–50%) for layering
-
Add basemaps (e.g., satellite imagery) for context
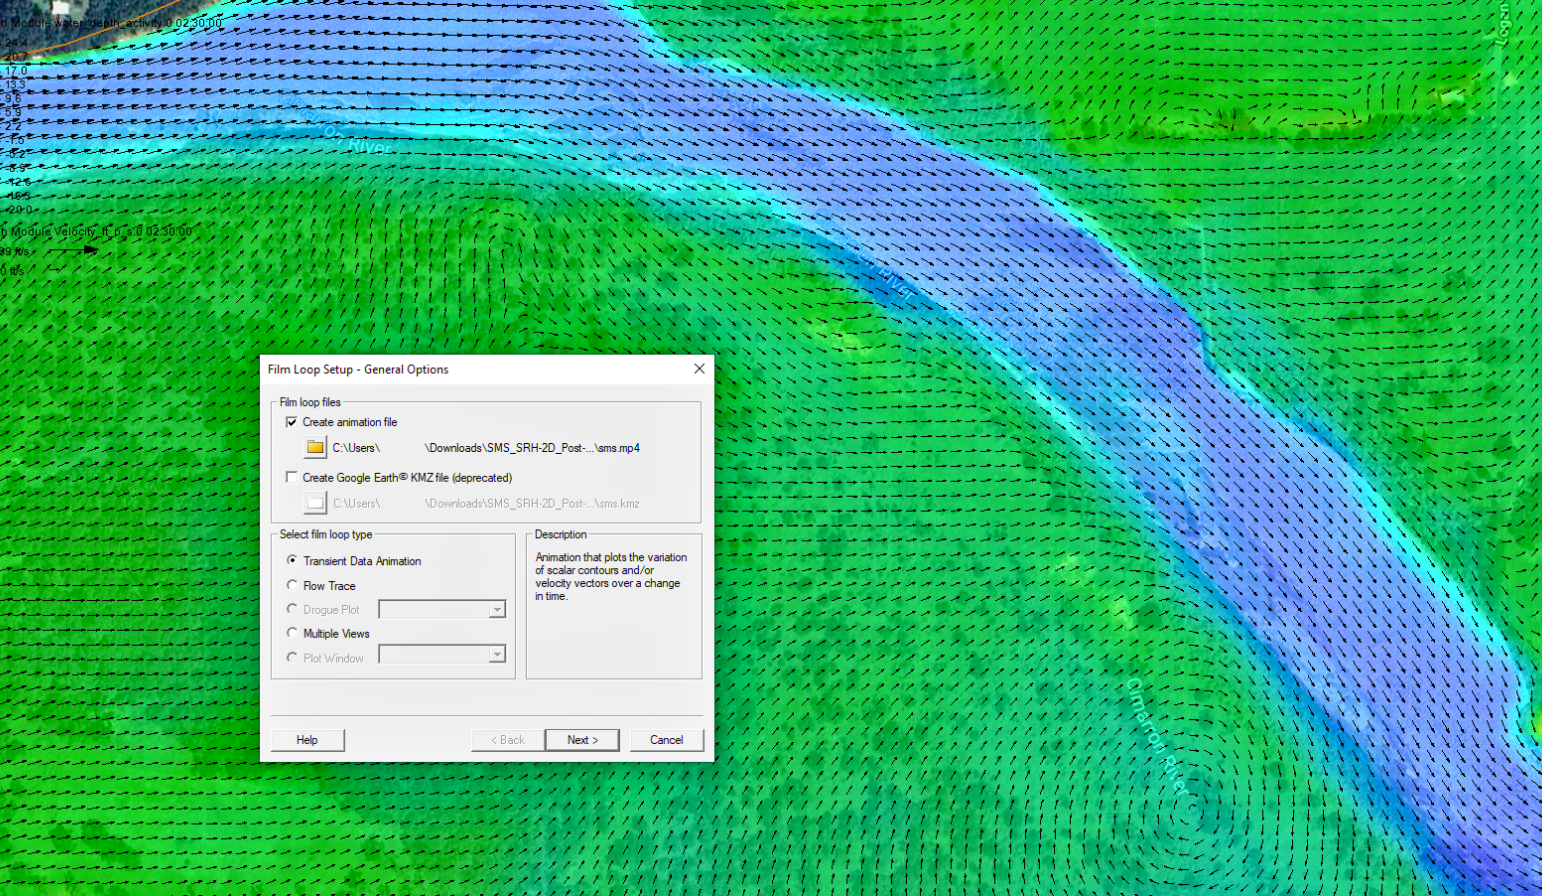
Create the Animation
Navigate to Data | Film Loop… and select Transient Data Animation.
-
Set the time range and interval (e.g., 15-minute steps)
-
Choose a format: MP4 is preferred for compatibility and file size; AVI is an option for drogue plots
-
Adjust resolution and playback speed as needed
-
Preview your animation before saving
Enhance for Presentation
For clearer and more engaging animations:
-
Add a timestamp overlay to show time progression
-
Create Flow Trace or Drogue Plot animations to show particle movement through the flow field. Drogue plots let you define starting points and track paths, speeds, and distances—along with optional reports
-
In SRH-2D, you can add 3D structures like bridges or culverts to show interactions with floodwaters and improve realism
Best Practices
To make your flood animations clear and effective, focus on simplicity and consistency. Avoid cluttering your visuals with too much detail—highlight only the key flood dynamics that matter most. Providing geographic context is vital, so include basemaps and label important features like roads and landmarks to help viewers orient themselves.
Use consistent color scales across all datasets to maintain visual harmony, especially when comparing multiple scenarios. Always export and pre-render your animation to ensure smooth playback; live rendering can cause delays or glitches. Complement animations with static visuals such as summary maps or screenshots to reinforce your main points and aid discussion.
If sharing a blog or report, add one to three images showcasing key steps or final results. Strong visuals improve understanding and keep your audience engaged.
Conclusion
Animating flood maps in SMS turns technical flood simulations into accessible, time-based visuals. Whether you’re informing city planners, emergency responders, or the public, SMS animations help communicate when, where, and how flooding can happen, making flood risk understandable and actionable.
Download SMS today to start experimenting with flood animations today!
August 12, 2025
|
View: 4276
|
Categories: SMS
|
By: <a class="mp-info" href="https://aquaveo.com/blog/author/admin">Aquaveo Staff</a>
About the Author

Performing a Silent Install of XMS (Passwords & Hardware Locks)
October 10, 2018
Computing Basin Curve Numbers in 9 Easy Steps
May 16, 2023
Converting a NET File to an INP File
May 9, 2018
Performing a Silent Install for ALS
October 27, 2021
Tips for Finding Information on the XMS Wiki
September 25, 2019
Tips for Modeling Bridge Scour
May 19, 2026
Essential Guide to WMS Rain-on-Grid Modeling
May 5, 2026
Best Practices for Modeling Complex Geometries
April 28, 2026
Managing MODFLOW 6 Data: Lists, Copy Period & CSVs
April 21, 2026