We use cookies to make your experience better. To comply with the new e-Privacy directive, we need to ask for your consent to set the cookies. Learn more.
Changing the Hydrograph Display in WMS
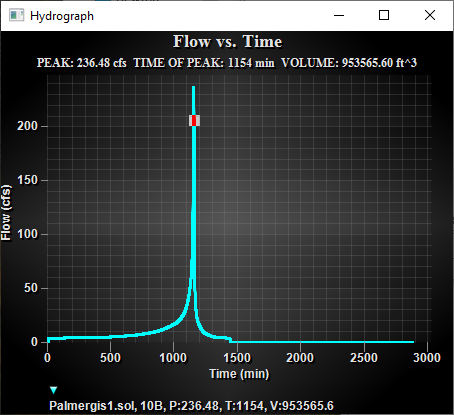
One of the more useful functions of WMS is displaying hydrographs. But did you know that WMS provide a multitude of ways to display each hydrograph?
Using the hydrograph display options allows you to alter the display of each hydrograph to better show the hydrograph data. To customize the WMS hydrograph display, right-click on the open hydrograph and select Display Options. This brings up a dialog with options to change the display for that hydrograph.
Below is a summary of the items that can be customized on each of the Display Options tabs.

- The General tab allows changing items such as the hydrograph title and subtitle as well as the border style and viewing style. It also allows for changing the font size. The grid lines are also controlled here to let you decide the line precision and if the x and y lines will be shown.
- The Plot tab contains a number of present plot options to adjust how the hydrograph data is shown. Some of the options include changing to a bar graph, only displaying points, using 3d display, or selecting different line graphs.
- The Axis tab define how x and y axis are displayed. Specifically, the values range shown on these axis can be truncated or adjusted.
- The Font tab controls the font used for the title, subtitle, points, axis, etc.
- The Color tab allows changing the color of the plot labels and area. A number of preset color options are also included.
- The Style tab changes the size, style, and color of the point and lines used in the hydrograph.
Once you have set the hydrograph displays to best show off the data, you can export your hydrograph. Hydrographs can be exported either by right-clicking on them and choosing Export/Print, or by choosing the Export button from within the Display Options dialog. Export formats include JPG, PNG, and text files. Hydrographs can be printed, copied to the clipboard, or saved to a file location.
Now that you have more tools for working with hydrographs, try them out in WMS today!


