SMS

Incorporating Rubble Mounds in CMS

CMS-Flow and CMS-Wave are two of the principal components of the Coastal Modeling System. Rubble mounds are an important part of some coastal modeling projects. They are a common engineering structure used as jetties, breakwaters, seawalls, and groins for shoreline protection as well as flow and sediment transport control.

The way rubble mounds are implemented in the Surface-water Modeling System (SMS) is different depending on which CMS model you pick. Rubble mounds in CMS-Flow simulations focus primarily on sediment transport and morphology changes, while CMS-Wave focuses on wave processes. Both of these CMS models have their own coverages and sets of requirements in order to add rubble mounds to the project.

Rubble mounds can be added to CMS-Flow simulations through the CMS-Flow Rubble Mound Jetties coverage. Once this coverage is added, you can create a polygon in the Graphics Window that represents the rubble mound. Double-clicking on the rubble mound polygon opens the Rubble Mound Jetty Attributes dialog where you can define the parameters of the rubble mound structure. This dialog includes inputs for the name, the rock diameter, the porosity, the base depth, and the calculation method. After defining all the parameters, the coverage is ready to be added to the CMS-Flow simulation. Finally, make sure that Calculate sediment transport is turned on in the Model Control , otherwise your rubble mound is just a random polygon that has no effect on the final simulation.

Example of a rubble mound in CMS-Wave

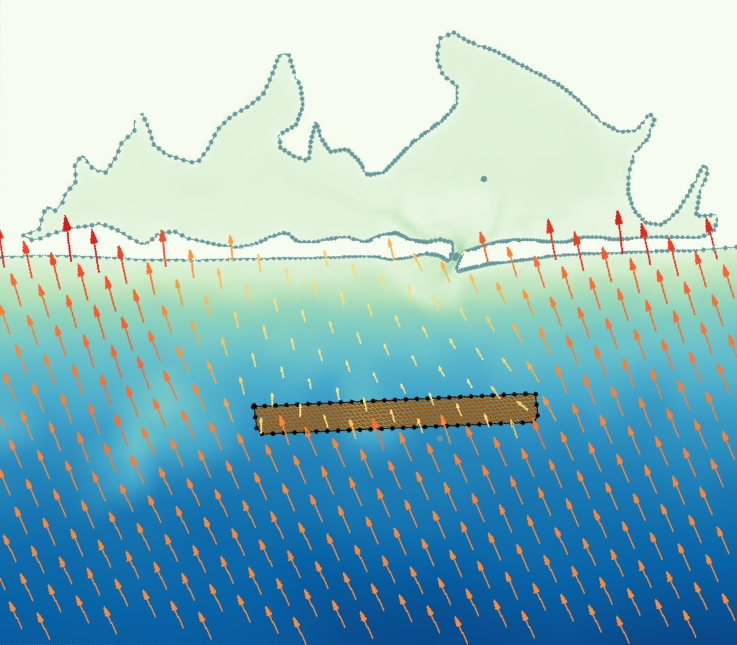
Rubble mounds in CMS-Wave simulations work a little differently than CMS-Flow. CMS-Wave doesn't have a specific rubble mound coverage like CMS-Flow does. Instead, rubble mounds are defined on a CMS-Wave structures coverage. This behaves somewhat similarly to materials coverages that you may be familiar with in other SMS models. Double-click the polygon representing the rubble mound to bring up the Assign Structure dialog. Then you'll add a structure with the green plus sign, select "Rubble-mound" from the structures dropdown, and then whether or not you want to modify the rubble mound by elevation. If you'd like, you have the option of customizing the color and texture SMS will use to fill your polygon structure to something that best suits your project.

CMS-Flow and CMS-Wave each require their own simulations, but you have the option to couple them using inline steering. This is a great option if you're building a comprehensive coastal model.

Head over to SMS and try out adding rubble mounds to your CMS project today!

Blog tags: 

Deciding between SRH-2D 2D Bridges and 3D Bridges

In the Surface-water Modeling System, you have the option of adding either a 2D or a 3D bridge to your SRH-2D model. But what are the differences between 2D and 3D bridges, and how can you know which one is the best fit for your SMS project? There are pros and cons to each, so we will briefly explore each option, and hopefully by the end you’ll have a better idea of what works best for you.

Starting in SMS 13.3, the 3D Bridge component that was used in previous versions was retired in favor of 3D Structures. 3D Structures can be used to build 3D bridges as well as culverts, and can also be used to calculate overtopping, an option that wasn’t available with 3D Bridges.

SRH-2D 2D bridge example

For 2D bridges, you have many options to help you customize your bridge, such as setting the bridge width, type and number of piers, abutments, etc.. (For the full list, go to this page of our wiki). All of the options that exist for 2D bridges are also available when building a 3D bridge. Using the 3D structures coverage to build your bridge allows for even more customization, including being able to shape the bridge ceiling so there is variation rather than being a constant along the full length.You can also use the 3D structures dialog to add a UGrid to the Project Explorer so that you can see what the bridge will look like with the mesh. The 3D structures coverage dialogue is able to generate a mesh footprint for your bridge, which automatically includes voids in the mesh for your piers so you don’t have to create them manually.

SRH-2D 3D bridge example

If you have questions about the specifics of building a 3D bridge, check out the new 3D Structures tutorials, or our wiki page on 3D Structures to get a more thorough introduction.

Building a 3D bridge into your project is an excellent option when you want to go the extra mile with the visual representation of the bridge. Although the idea of using a 3D bridge for everything may sound great because of the extra visualization options, a 3D bridge isn’t going to be necessary, or even practical, for every project. SMS’s calculations will turn out the same regardless of which bridge type you pick. 2D bridges are often a better choice if you’re looking for just a quick representation for your bridge, or if you’re modeling multiple bridges at the same time. Having multiple 3D bridges can slow down the processing speed in a way that having multiple of their 2D counterparts wouldn’t.

Head over to SMS and try out the 2D and 3D bridge building tools in 13.3 today!

Blog tags: 

Understanding SRH-2D's Monitor Coverage

Being able to determine hydraulic parameters at specific locations in the model domain is a handy, and sometimes even necessary, tool for any SRH-2D model. That is why there is a specific coverage in the Surface-water Modeling System (SMS) where you can create monitor objects that will collect the information you need during the simulation run. This blog post will cover some information that you may find useful when trying to make the most out of your monitor coverage.

SRH-2D outputs monitor data at a fixed interval of every 100 time steps. This is important to keep in mind if you’re looking to collect a certain amount of data from your monitor points or lines. You may need to adjust the size of the time steps depending on what kind of output you need.

SRH-2D monitor points output file
Monitor Points

When creating monitor points on the SRH-2D monitor coverage, it is recommended that you create at least three monitor points: one near each end of the model domain, and one in the middle. During the simulation run, SRH-2D collects data at the points about a number of things, including but not limited to: the position in the X and Y direction, bed elevation, water elevation, and water depth.

Monitor Lines

Monitor lines can help you verify the continuity and model stability of your SRH-2D simulation. SRH-2D uses monitor lines to calculate the total flow and average water surface elevation along the arc. Monitor lines work best when they cross a river rather than running parallel. Lines with too many curves can cause difficulties in snapping to the mesh properly. Monitor lines can be placed anywhere along a river, but we recommend that one be created near the inflow and outflow boundaries. Remember to use monitor lines judiciously. Too many monitor lines can bog down your simulation, or even keep it from converging properly.

Monitor Output Files

Monitor output files are automatically exported to the location of the project files using this directory format: \[Project_Name]_models\SRH-2D\[Simulation_Name]\Output_Misc. The Output_Misc folder contains a DAT file for each of the monitor features using the *[Simulation_Name]_LNn.dat naming convention for lines, and *[Simulation_Name]_PTn.dat for points. These files contain all the data for each individual point or line, and can be opened in your prefered text editor application.

SRH-2D Solution Plots

We covered how SRH-2D solution and monitor plots work in a blog post a while back. If you’re interested in learning more about solution and monitor plots and how to use them, follow this link to our website.

Head over to SMS and try out the monitor coverage with your SRH-2D model today!

Blog tags: 

Handling Depth vs. Elevation

When creating a surface-water model, your model will make use of bathymetry data as either elevation or depth. Knowing how the Surface-water Modeling System (SMS) represents depth versus elevation is vital when it comes to creating, running, and understanding a model. SMS uses several different numerical models, and some models require that depth be negative and elevations be positive, while other models require the opposite.

It can become confusing when trying to remember what is needed for each model, which is why the decision was made to standardize how SMS treats elevation and depth across all models. SMS treats all depth values as negative and all elevation values as positive. That way you don’t have to remember how data needs to be entered for each model. If depth data is entered with positive values, SMS will read the data as part of the land elevations, which will produce incorrect calculations.

Depth/elevation shown on a grid

Some of the most used models where you may see that the elevation values have been changed to fit SMS’s conventions after importing are CMS-FLOW, CMS Wave, and CGWAVE. If you’re not sure whether or not the imported elevation data has been changed and would like to check, then this is a great time to make use of the Mesh module’s find function. Under both the Nodes menu and the Elements menu you’ll see a Find… option listed. You can use this to quickly locate a specific node or element inside of SMS to compare the elevation data with the model’s files outside of SMS.

If SMS has changed the values of the elevation data to account for the required negative depth value, there is no need to be concerned about how this will affect the end result for your model. SMS automatically adjusts the data to match the convention of the model when the project information is exported to the model executable.

Take this information and head over to SMS, more confident that your project’s elevation data will be handled correctly.

Blog tags: 

Pages