SMS

Using Snapping in SMS

In many projects, you might find a need for nodes or vertices to line up exactly. You can achieve this by using the Snapping feature in SMS. Snapping nodes to arcs can be accomplished two ways in SMS: by cleaning and by using the snapping crosshairs. In some cases, two arcs might need to be very close to each other but not snapped to the same nodes or vertices on a mesh. This post will discuss how all of this works.

Clean Option

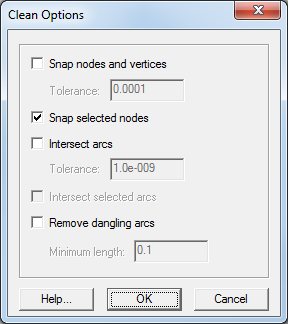
The Clean option allows any two nodes on the same coverage to be "snapped" together To snap two nodes on the same coverage:

  1. Select the desired nodes.
  2. Select the Clean... command from the Feature Objects menu.
  3. In the Clean Options dialog, turn on Snap selected nodes.
  4. Select the desired node as the snapping point.

The nodes will be merged into one node at the desired location.

Nodes and vertices can also be snapped using a tolerance value. This will snap all nodes in the coverage to be within the tolerance.

  1. Select the Clean... command from the Feature Objects menu.
  2. In the Clean Options dialog, turn on Snap nodes and vertices.
  3. Set the Tolerance level.

The tolerance units are the same as those set in the projection. This method may cause vertices to be redistributed along some arcs, so it should used carefully.

Snapping Feature

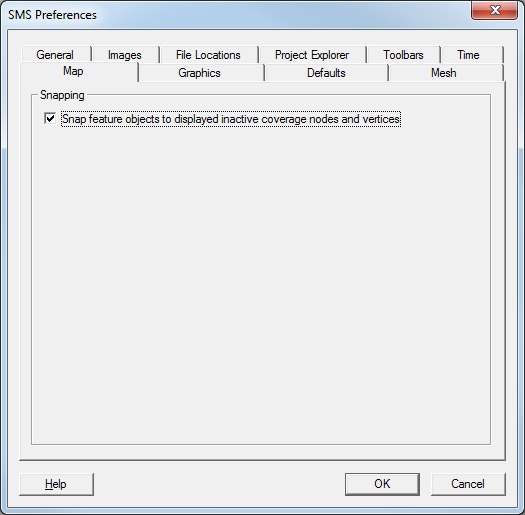
If Snapping is turned on the Map tab in the Preferences dialog (see image below), red crosshairs (see image below) will appear when creating an arc and the mouse moves near an existing node or vertex. This indicates that the node or vertex will snap to the existing node or vertex in the coverage. If two vertices snap, they turn into a single node. Snapping can be turned on and off when in the Map module by pressing "S" on the keyboard.

Snapping Across Multiple Coverages

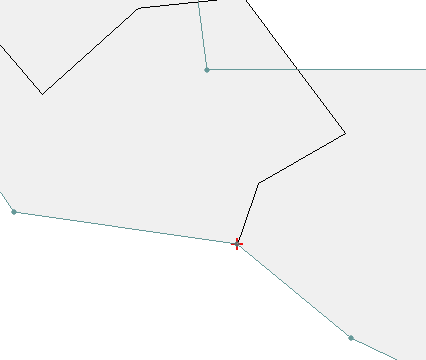
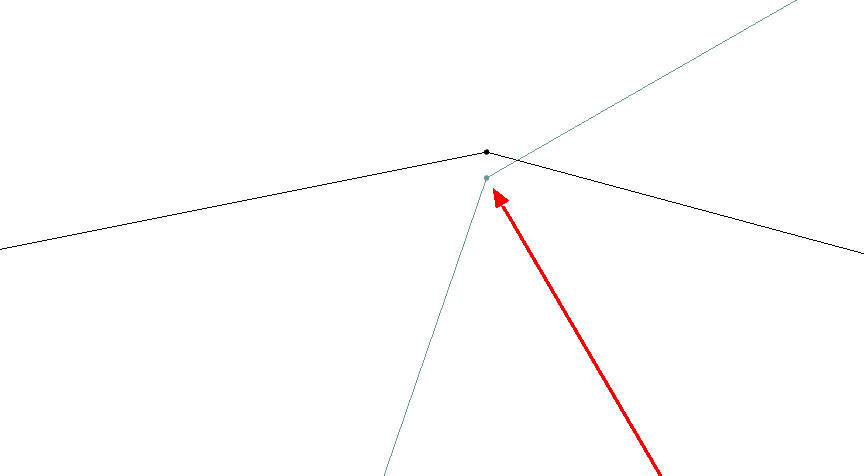
To snap across multiple coverages, Inactive coverages must be turned on in the Display Options dialog. This prevents nodes or vertices from appearing to be snapped when they are not (see the images below). The first shows what appears to be two vertices that are snapped. The second shows a zoomed view showing they are not actually snapped.

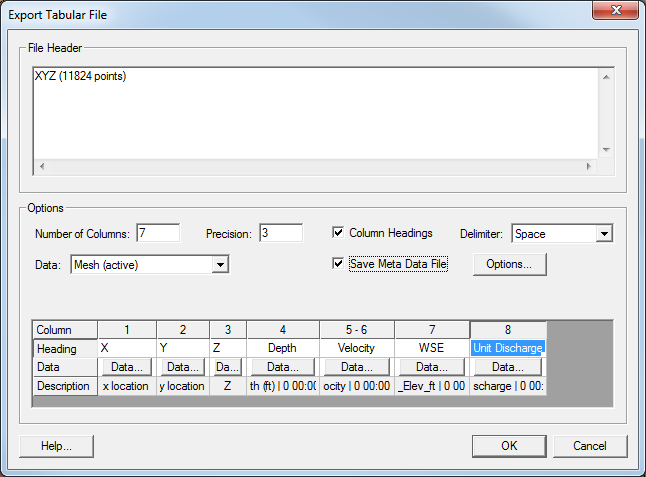
Snapping can also occur between a coverage and a geometry such as a mesh or a grid.

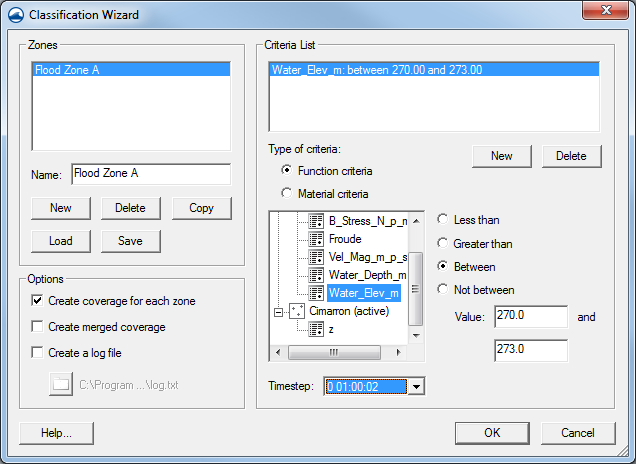
Nodes That Should Not Be Snapped

Keep in mind that if two boundary arcs are close to the same node(s) on the mesh or grid, a simulation may snap them to the same node(s) within the simulation, which may cause errors. This can be fixed by either refining the mesh or grid so there are more nodes to use, or by moving one or more of the arcs slightly.

Try using the snapping feature today in the Community Edition of SMS.

Blog tags: 

Using Zonal Classification in SMS

Needing to identify part of your model that is prone to flooding? Or do areas of your project need to be marked off as a fish habitat?

While there are many tools in SMS that can be used to designate areas of a project as something different, one of the easier ways is to use Zonal Classification tool.

  1. Begin with opening your project containing scalar data. The scalar data can be loaded into the Scatter module, or be part of a 2D mesh or 2D grid.

  2. Next, open the Zonal Classification tool. Do this by selecting the Zonal Classification menu command in the Data menu in either the Scatter, Mesh, or Grid module.


  3. Once the Zonal Classification dialog is open, start setting criteria to define your zones. In the section titled “Zones”, click the New button to create your zone. You can define multiple zones at once while in the dialog.

  4. Once you’ve created your zones, you can define the criteria for each zone. Select the zone and click the New button in the Criteria List section. The criteria can be one of two types: a function criteria or a material criteria.

    As you’ve probably guessed, function criteria use a formula you specify to create the zone. Say you want to identify areas on your mesh below an elevation of 50 feet because those are areas you need to mark off as being prone to flooding. You’ll select the Function criteria option, select your elevation dataset, check the Less than option and enter a Value of 50.

    Similarly, you can choose to create zones based on materials. The materials need to have already been defined in the project before this option can be used. Once the materials are defined, you can create zones that either include or exclude areas of your projects where the zones overlap your scalar data.

  5. Finally, once, you’ve defined your criteria, you can have SMS create a new map coverage with polygons around the defined zone areas.

Try using zonal classification in SMS today!

Blog tags: 

Exporting a Delimited Text File

Sometimes, the best way to share your solution data is through a text file. Data in text files can be formatted in a variety of ways, but delimited text files are supported by the widest range of applications out there.

Creating a delimited text file out of your SMS project is a little different than simply exporting the project as a text file.

  1. Select the Save As command in the File menu.
  2. In the Save As dialog, change the File type to be Tabular Data File (*.txt). This tells SMS you want to create a delimited text file.
  3. Enter a name for your file and make certain it is being saved to the correct directory.

After clicking Save in the Save As dialog, the Export Tabular File dialog should appear. In this dialog, you can specify how you want SMS to organize your file. You can select how many columns you want to have in your file and how those columns are going to be separated using a space, tab, or comma.

Importantly, you will need to select which data you want to have exported. You can select which mesh, grid, or scatter set you’d like to use, then define what will go in each column of the file.

The names of the column heads can be specified. If this option is used, the name of each column must entered in the column spreadsheet at the bottom of the dialog.

Clicking on the Data buttons in the column spreadsheet at the bottom of the dialog will bring up a dialog that lets you pick which datasets to include in each column. Normally, this will be your x, y, and z values. However, if you have more columns you can include other datasets. Both steady state and transient data can be exported.

You can also choose to have metadata saved with your file. This could include data such as the project projection or a polygon around the data boundaries.

Once done with organizing your file, click OK in the Export Tabular File dialog to save out your file. You can now send the text file to colleagues or use it in other projects with any software that can support a text file.

Try creating a delimited text file in the SMS today.

Blog tags: 

3 Great Features in SMS 12.3 Beta

Every new version of software comes with many new features and updates. The release of SMS 12.3 Beta is no different, with scores of updates and tweaks to make the user experience better. Most of these changes are behind the scenes, but we’d like to highlight three features which will prove very useful to our users.

1. Generating an observation arc plot

Right-clicking on an arc in an observation coverage now has the option to directly generate an observation profile plot from the selected arc. This allows you to see the elevations for the stream at that location. It is also faster than using the Plot Wizard. Simply use the Select Feature Arc tool to right-click on the specific arc and select Show Observation Plot.

2. Transparency options for filled polygons in the Map module

A transparency can now be set for filled polygons in the Map module. This means that materials coverages and other filled polygons can be better aligned with other coverages and GIS data such as background maps. Open the Display Options dialog, select "Map" from the list on the left, and turn on Fill in the Polygon section to access the Transparency slider.

3. Setting the Default Contour Range options

Some models include spin up or ramp times during which the numerical results are not within a typical range. This option provides a method for instructing SMS to skip these atypical or unreasonable values from impacting the default ranges of the contours computed.

Select Edit | Preferences… to bring up the Preferences dialog, then click Default Range Options in the Transient Contours section of the General tab to bring up the Default Transient Contour Range dialog. The dialog allows the first n time steps or hours to be skipped when creating the contour range, or to use the current time step.

Try out these features today by downloading the SMS 12.3 Beta.

Blog tags: 

Pages