SMS

New Floodway Delineation Tool in SMS 13.0

City planners, developers, and others have a great interest in using available land. Sometimes that land is close to areas that flood, so precautions need to be taken so the build site is not too close to (or directly in) the potential flood area. Failure to properly plan and delineate a floodway can potentially cause millions of dollars in flood damage as well as potential losses in property values. Hurricanes Harvey and Florence, with their extreme rainfall amounts, are prime example of why floodway delineation is so important.

In addition to the guidance provided by the Federal Emergency Management Agency (FEMA), the new Floodway tool in SMS allows the extents of a floodway area to be more clearly defined. This tool allows planners, developers, and others to run multiple simulations to determine the safest places to build as well as the places which may be most impacted during a significant flooding incident.

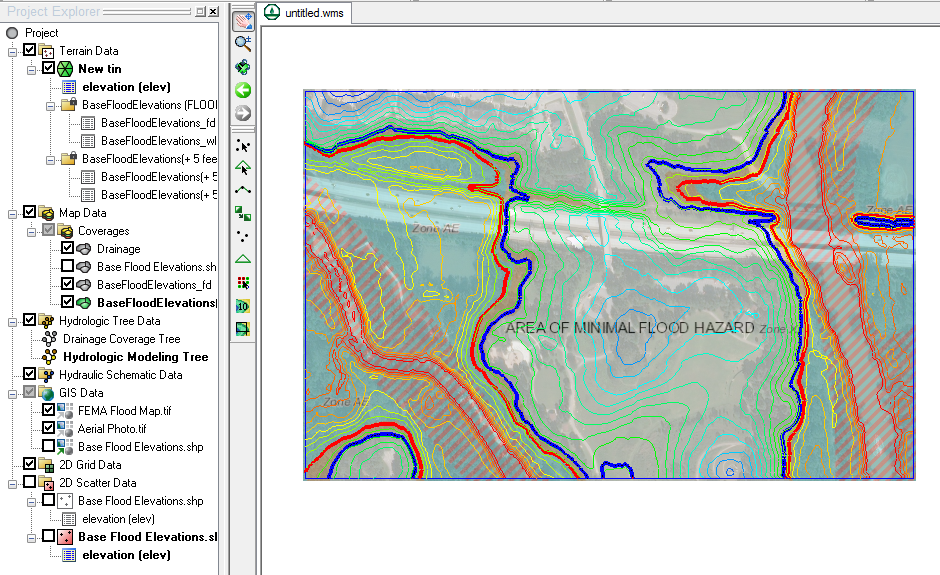
To use the Floodway tool in SMS, a project must have a either a Cartesian grid, a 2D mesh, or a 2D scatter set that has simulation result datasets for at least water depth and velocity. Two coverages are also required: a 1D hydraulic centerline coverage and a 1D hydraulic cross section coverage.

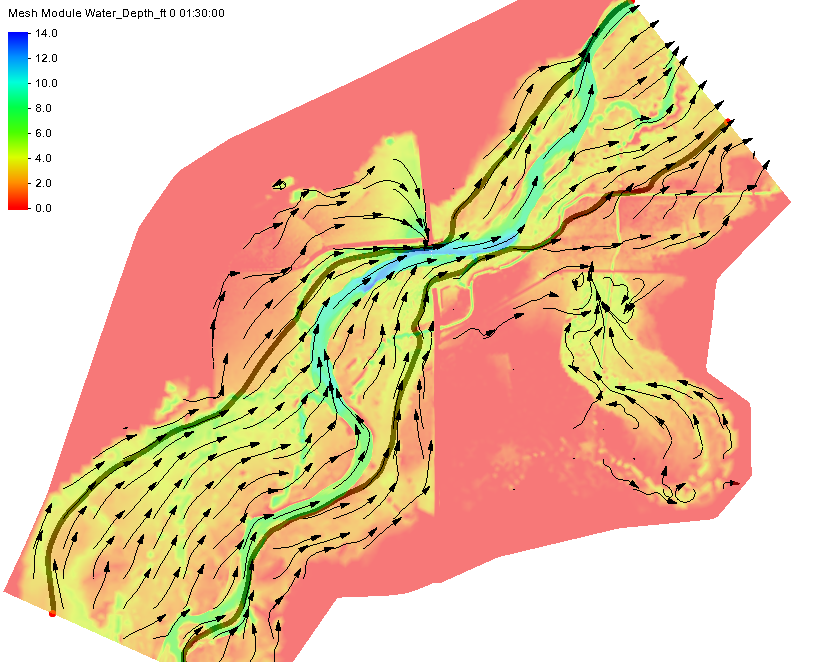
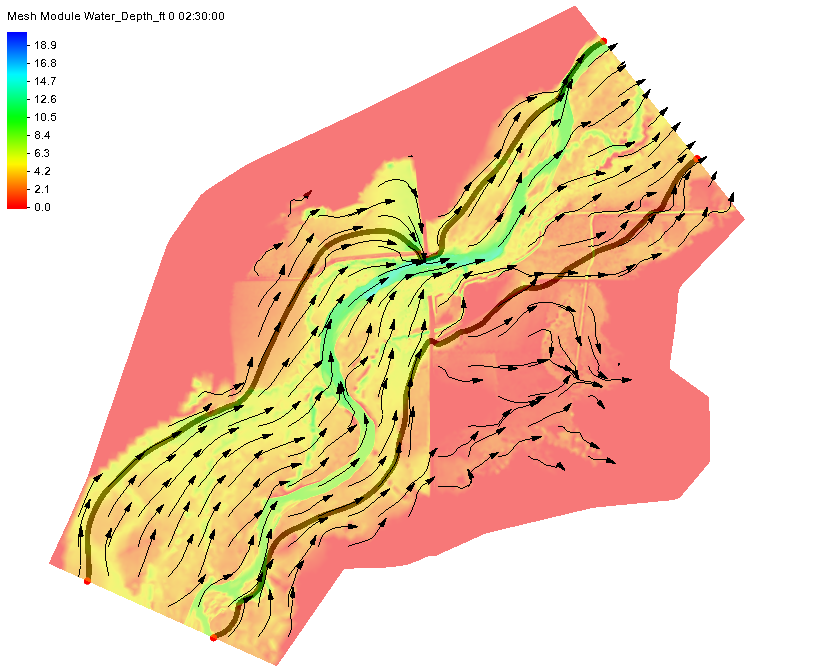
The way the Floodway tool works is by calculating how far in from both sides of a river or stream that vertical walls can be placed and raise the center of flow by the targeted maximum rise. FEMA suggests this rise should be no more than 1 foot. These calculations use the input provided by the water depth dataset, the velocity dataset, and the two hydraulic coverages to define the floodway extents along the entire length of the study area.

Once these extents are known, the data can be used when making area planning and development decisions at all levels of government and businesses. You can try out this feature in SMS 13.0 beta today.

Blog tags: 

Quickly Delineating a Floodplain

How many watershed projects require knowing which areas are in a floodplain? There is a lot of debate over building on floodplains, but before that debate can happen, the location of the floodplain needs to be known.

A new feature in WMS makes this process quick and simple.

The Map Flood tool utilizes ground elevations and existing flood hazard maps from the Federal Emergency Management Agency (FEMA) to quickly visualize the impacts of possible modifications in the flood level. The tool is designed to utilize data from web services including ground elevations, flood hazard base flood elevations, and flood hazard floodplain extents.

The Map Flood tool is accessed by clicking on the Map Flood icon in the toolbar.

Running the tool will do the following:

  • Download elevation data for the area which is stored as a scatter set
  • Download base flood elevation lines for the area which is stored as a map coverage
  • Download a flood extents polygon which is stored as a map coverage
  • Download a flood insurance map as a image in the GIS module
  • Create a water surface elevation for the base flood
  • Create an offset water surface elevation for the modified flood level
  • Compute a new flood extent polygon for modified flood level

For locations that do not have FEMA data, you can use your own data to generate flood extents. As long as a ground elevation dataset and a water surface elevation have been imported into a WMS project, then the Map Flood tool can be used to create a fast floodplain. This data needs to be imported into WMS as either a 2D scatter set or a TIN.

Using the new Map Flood tool can greatly reduce the time it takes to delineate a floodplain. Try out the new Map Flood tool in WMS 11.0 today!

Blog tags: 

What We Learned at the 2018 Aquaveo User Conference

Aquaveo held its first annual User Conference from October 16-17, 2018! It was amazing to get to meet so many of our users at once. We hope everyone had a great time.

For us, it was exciting to meet users from all over the world. We met users from the United States, Canada, Portugal, Germany, the United Arab Emirates, Guyana, and Thailand. When asked why they came, the attendees said they came to learn:

  • How Aquaveo’s products can help with their projects
  • More of what Aquaveo has to offer
  • What Aquaveo is all about

In listening to what our users had to share with us, we took away a couple key items that you want to see improved in our software.

  1. You want modeling to go faster. We understand the demand to give results in less time is growing, so we will be looking at ways to make the process of modeling take less time and still be accurate. Some of the innovations added into Aquaveo’s software already significantly reduce the time it takes to complete a model. We hope to add more automation and tools to speed up modeling times.
  2. You need to be able to work with big data. More data is becoming available and you want to be able to use it. This means processing large files covering larger areas in more detail. At Aquaveo, we are working on doing this, including optimizing our code and adding new tools to work with large files such as lidar files.

We’d like to thank the following for participating in our user conference:

If you couldn’t make it to the Aquaveo User Conference this year, we will be having another one next year. Watch our website and Facebook page for future details. See you next year!

5 New Features in SMS 13.0 Beta

We’re happy to announce the beta version of SMS 13.0 is now available. Our developers have been working hard to improve SMS to make the user experience more enjoyable.

To help you learn about some of the new features, we’ve compiled this list of three new features in SMS 13.0 Beta.

  1. Notes can now be added to Properties dialog. Right-clicking on most items in the Project Explorer now have a Properties command that will bring up a dialog with a Notes tab. We have found many uses for this, including making notes about the differences between different map coverages or scatter sets.
  2. New tools to support the use of lidar data. You might have used lidar files in the past and noticed that the interface was a little confusing and sometimes slow. After examining how the process could be improved, we made improvements to the import process and changed how SMS interacts with lidar data. We hope you find our new lidar functionality is both faster and makes working with lidar data easier.
  3. A bridge scour coverage has been added. This allows exporting bridge scour values to the Hydraulic Toolbox to use in analyzing a bridge site. This tool requires having a 2D mesh with elevation data, a water surface elevation, a water depth, and velocity datasets. Most of the values needed will be automatically generated, making bridge scouring faster and easier.
  4. Floodplain delineation has been improved using the Map Flood tool. This tool allows accessing FEMA data to automatically designate flood areas in your project. The tool can also work with local data provided as a scatter set.
  5. A 2D scatter set can now be converted into a raster file. Right-clicking on scatter set item in the Project Explorer now has a new Raster -> Scatter command. Creating a raster from your scatter data can help facilitate sharing data across different applications.

These are only some of the many new and updated features in SMS 13.0 Beta. You can find a bigger list of them here. Along with these new features, we are also excited to offer new tutorials instructing users on how to best utilize the new features. Try out the beta by downloading it today!

Blog tags: 

Pages