GMS

Stockholm GMS Training 2018
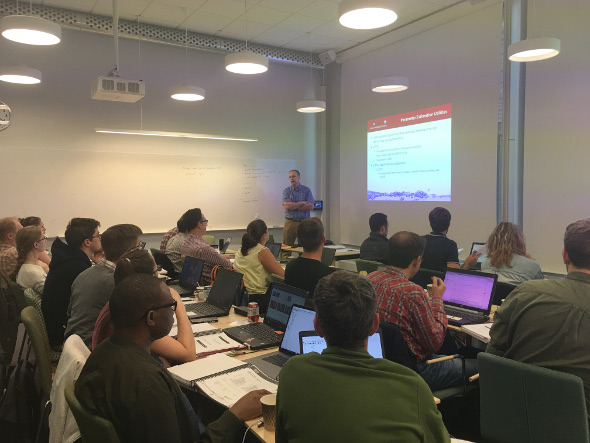
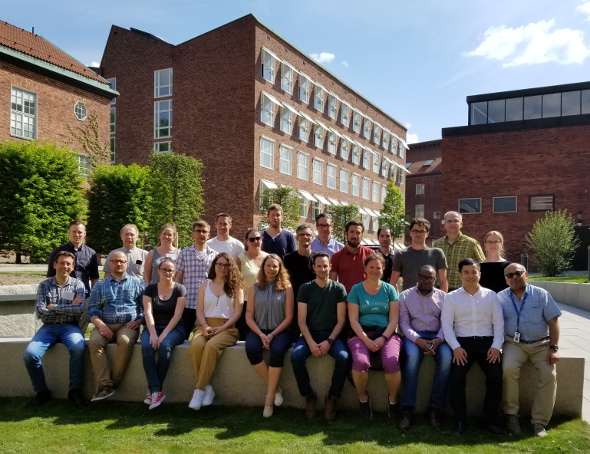
Aquaveo recently taught a three-day GMS training session hosted by the School of Engineering Science at the KTH Royal Institute of Technology in Stockholm, Sweden. The institute’s Prosun Bhattacharya arranged and coordinated the training session.

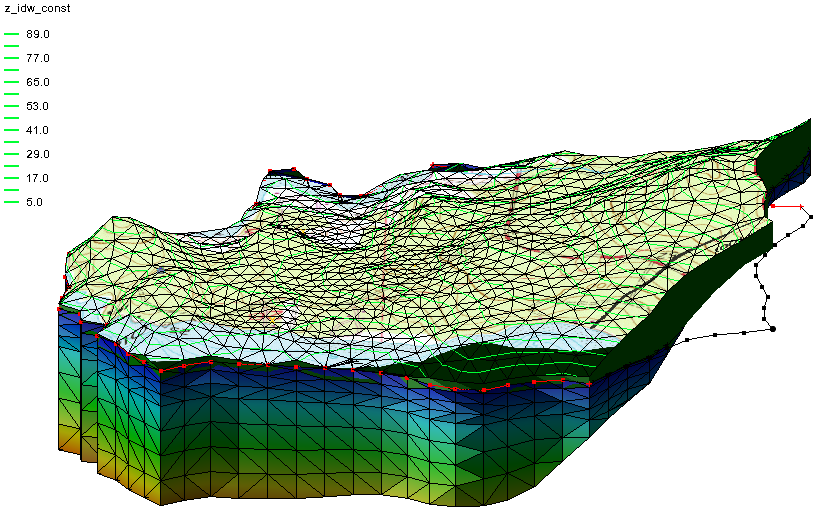
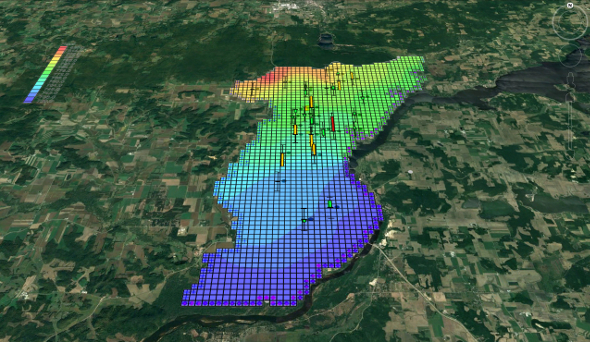
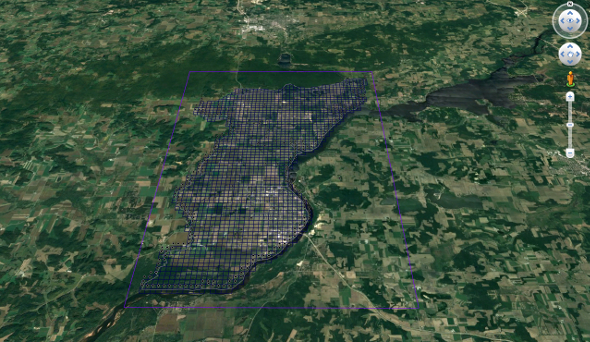
From May 15-18, 2018, Alan Lemon and Hoang Tran presented on a wide range of topics, including general groundwater modeling concepts, using MODFLOW in GMS using both grids and conceptual models, incorporating field data (such as scatter point and borehole data) into a GMS project, and calibrating models in GMS. Models demonstrated and discussed include MODFLOW, MODFLOW-USG, MODPATH, MT3DMS, and SEAWAT.

Participants came from several different countries, companies, and governmental and non-governmental organizations, including:

There were also graduate students from Gdańsk University of Technology in Poland, and KTH Royal Institute of Technology and Luleå University of Technology in Sweden.

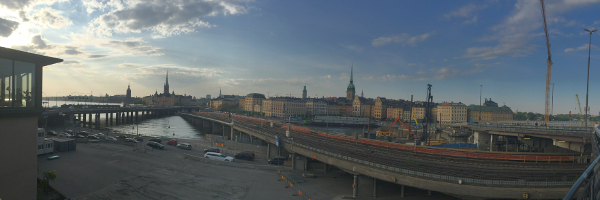
After the classes, Alan and Tran enjoyed walking around Stockholm and seeing the sights, including the Vasa Museum and the Nobel Museum.

Aquaveo provides custom, on-site training for SMS, GMS, WMS, ArcHydro Groundwater, and any other water resource modeling need you have. Organizations can set up shared trainings such as this one, or arrange for the same training for their own employees. You can learn more about our training offerings by visiting our site.

Blog tags: 

Draping an Image onto a Ground Surface

When looking at your GMS project in oblique view or when using the Rotate tool, you might have noticed that your map image will disappear. This is because GMS only supports viewing map images in plan view. However, there is a way to make the map image visible in these views.

The ability to drape an image in GMS has been around since the early versions. However, you may not have had an opportunity to use it, or you simply missed hearing about it among all the other great things GMS does.

When not in plan view, an image can be draped on the top surface of a TIN, mesh, or grid. When this is done, the map image will remain visible even when rotating the display view. Some relationships between the surface texture and the shape of the terrain can become visible after the image has been draped over the terrain surface.

If you didn’t already know how to drape an image in GMS, or you want a refresher on how to do it, this is what you do:

  1. Turn off Ortho Mode if it is active. Draping an image cannot be done using Ortho Mode.
  2. Select and make active the map image you want to view. You can use any image file type that GMS can import.
  3. Select a dataset under your grid, mesh, or TIN in the Project Explorer and make it active. A draped image is only applied to one dataset at a time.
  4. Open the Display Options dialog.
  5. Select the appropriate grid, mesh, or TIN display tab.
  6. Turn on the Texture map image option.
  7. Use the Rotate tool or any of the view options to see how the image mapped to the top surface of the geometry.

Here’s an example of how it will appear:

If desired, you can adjust the Lighting Options in GMS to make the features smoother or sharper.

Now that we’ve reviewed the steps, try draping images in GMS today using the GMS Community Edition.

Blog tags: 

Exporting Raster and Vector KMZ Files

Need to open your project data in Google Earth? GMS can do that by generating a KMZ file from your project data.

GMS allows creating either a raster KMZ file or a vector KMZ file.

Raster KMZ File

This option saves the project data as an image with georeferencing data. The data is clipped to match the current view in the Graphics Window.

To create the file:

  1. Switch to Plan View.
  2. Check that you are using geographic coordinates, otherwise it may be distorted.
  3. Use the File | Save As command.
  4. Set File of Type to be "Google Earth Raster KMZ File (*.kmz)".
  5. Select the Options button to set the resolution.

When pulled into Google Earth, a raster KMZ will simply display the file data as an image over the georeferenced location.

Vector KMZ File

This option saves the project data as vector information. All visible data in the Graphics Window will be included. Points, lines, and polygons will be saved in the file along with the georeferenced data.

  1. Switch to Plan View.
  2. Use the File | Save As command.
  3. Set File of Type to be "Google Earth Vector KMZ File (*.kmz)".

When imported into Google Earth, a vector KMZ will contain an image over the georeferenced location, along with a layers for any lines, points, or polygons contained in the file. These layers can be toggled on or off.

Transient Data

Transient data in GMS can be exported as a raster KMZ file animation.

  1. Switch to Plan View.
  2. Check that the project is using global coordinates.
  3. Select the Display | Animate command.
  4. In the Animation Wizard, turn on the KMZ file option.
  5. Set the options for where to save the file and what parameters to use.

After GMS generates the animation, you can open in Google Earth to see the results.

Now that you’ve seen how KMZ files can be generated, go ahead and give it try in GMS today.

Blog tags: 

Creating a Transient Animation

After creating a transient dataset, it can be time consuming to click through each time step to evaluate the changes over time. One of the fastest ways to view changes in transient data is to create an animation.

Creating an animation in GMS can be done quickly using the Animation Wizard.

Once you have a transient dataset with multiple time steps in your project, do the following:

  1. Select the dataset you want to animate and make certain your project is displayed how you want to see it in the Graphics Window. The animation will be created from what is visible in the Graphics Window.
  2. Select the Animate command in the Display menu to open the Animation Wizard.
  3. In the first part of the Animation Wizard, select where you want to save your animation, what file type you wish to use and the animation quality.
  4. In the second part of the Animation Wizard, set your time duration and add a display clock. The options here will vary depending on what options were selected in the first part of the Animation Wizard.
  5. When you click Finish, GMS will create your animation.

If you selected the AVI file format, GMS will display it for you in the Play AVI Animation application (Pavia). This player is included with your installation of GMS. If you selected the KMZ format, GMS will display your animation in Google Earth (if it is installed).

Once you’ve created an animation, you can view it again when you reopen the project. To do this, select the Play Animation command in the Display menu. This will tell GMS to locate the animation file associated with the project and open it in the AVI player. This operation only works for AVI files.

Files can be exported in either AVI format or KMZ format. The AVI file can be used with most other video players, including Windows Media Player or QuickTime Player. KMZ files can be opened with Google Earth.

With the basics down, you can now try creating animations for your own projects in GMS.

Blog tags: 

Pages